
What Building a GitOps Platform Actually Taught Us About Reliable Infrastructure
Getting an application into Kubernetes was the easy part. Making sure its database was ready, its configuration pointed to the right environment, its secrets existed, and its deployment could recover from failure took considerably more work.
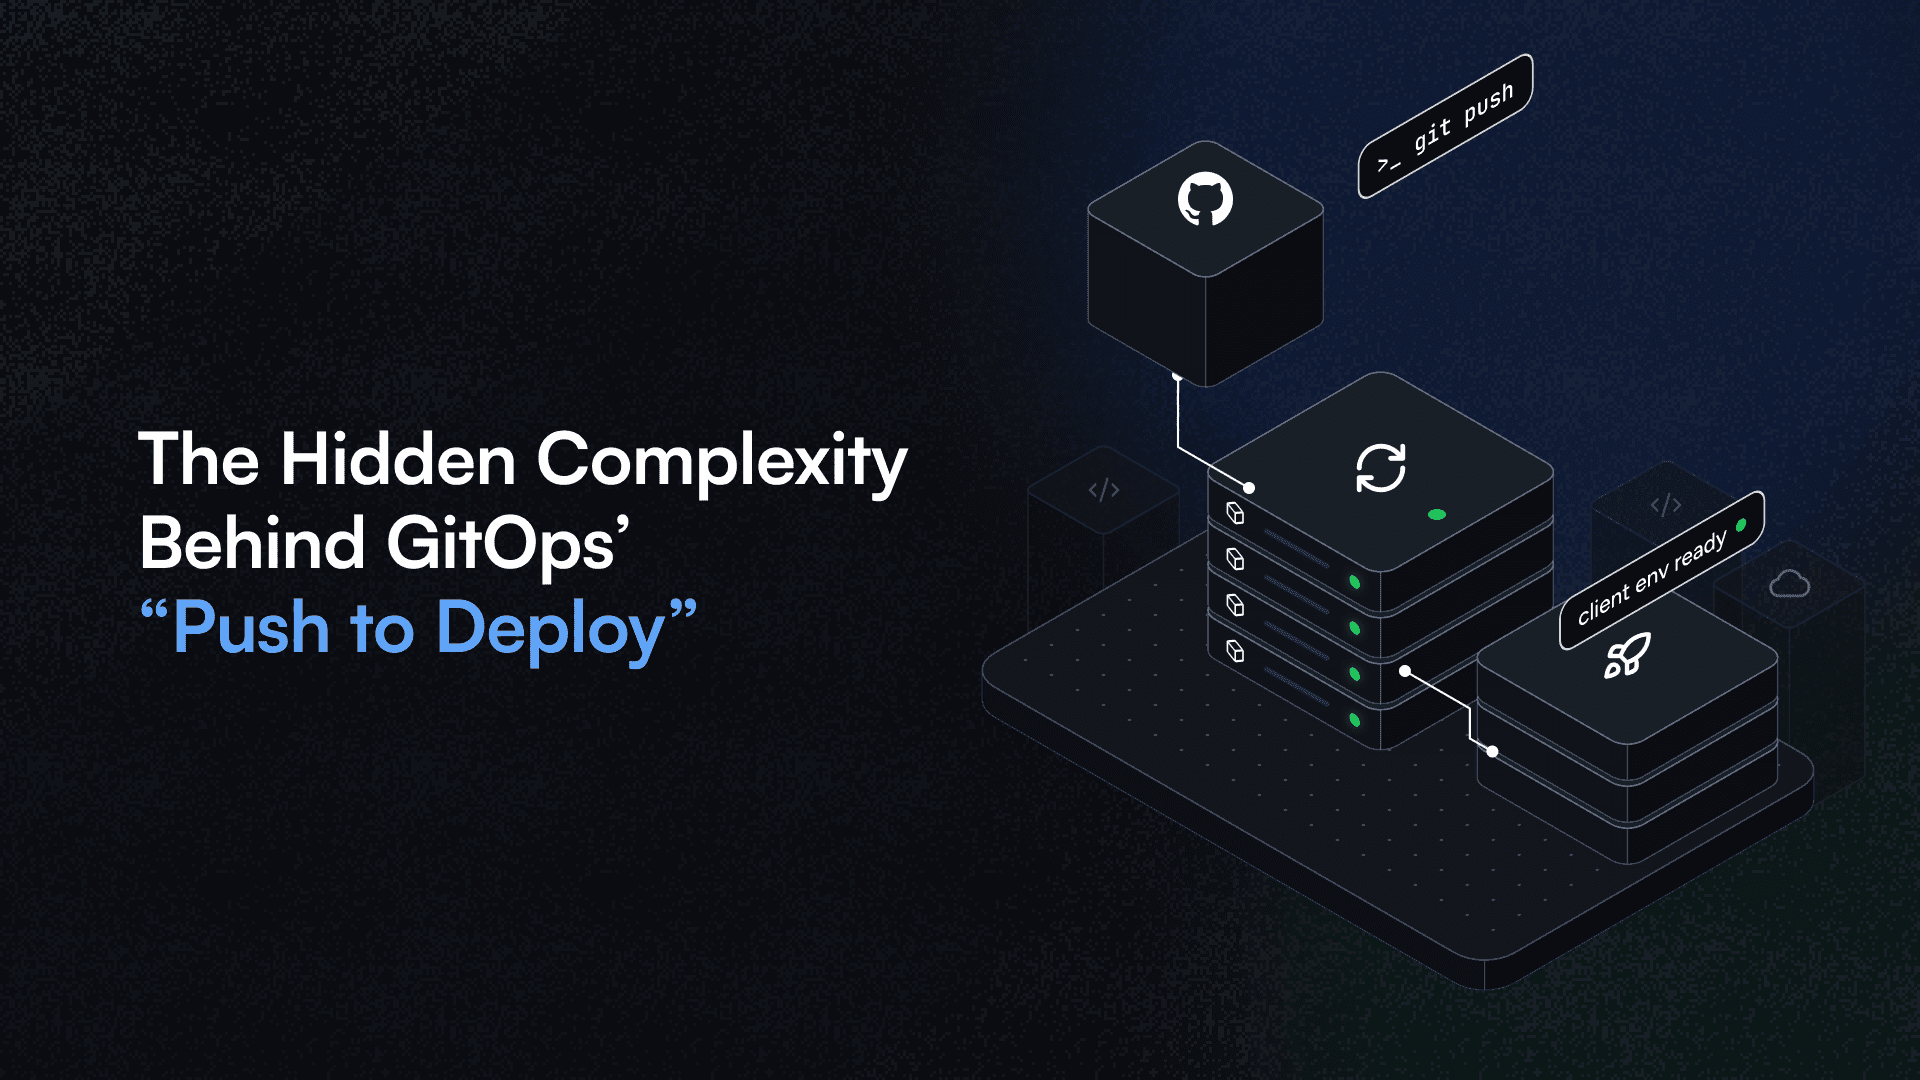
We spent roughly two weeks and 194 commits building a GitOps platform that provisioned isolated customer evaluation environments directly from Git. Adding a client configuration could trigger the creation of an entire environment without an engineer manually applying Kubernetes resources.
The provisioning flow worked. Operating it exposed a different set of problems: migrations ran too early, applications started before their dependencies were reachable, configuration changes broke existing environments, and deployments could get stuck waiting for the very changes needed to fix them.
These weren't problems with GitOps itself. They exposed the assumptions underneath our automation.
This is what building the platform taught us about making infrastructure provisioning reliable, and what our production observations and resource analysis revealed about its limitations.
TL;DR
- We built a GitOps platform in roughly two weeks, using ApplicationSets, Argo CD, and Helm, to provision isolated customer evaluation environments.
- A documented cold-provisioning run reached
Synced+Healthyin about 110 seconds. - Production incidents exposed a Redis/NATS startup race that left readiness checks returning HTTP 503 for more than three minutes across two client environments.
- We added a TCP-connectivity gate across 23 Deployments, along with explicit deployment ordering and changes to migration recovery.
- A historical CPU observation reported 39m used against 1,230m reserved, though the original record carries an unresolved inconsistency.
- Recalculating from the current Helm chart and live node capacity gives a projected ~10.2 CPU-bound or ~10.9 memory-bound environments per node.
The central lesson: declaring the desired state is only part of reliable GitOps. Dependencies, configuration compatibility, resource allocation, and recovery behavior matter just as much.
The Platform’s Numbers: Build, Failures, Capacity
Six figures frame the build and what operating it revealed. Each one is a historical observation or a calculation, not a repeated benchmark, and the sections that follow explain where each came from and what it does and does not prove.
Metric | Result |
|---|---|
Initial platform build | ~2 weeks |
Engineering activity | ~194 commits |
Cold provisioning | ~110 seconds |
Readiness failures | HTTP 503 for over 3 minutes |
Deployments using the dependency-readiness gate | 23 |
Projected capacity | ~10 CPU-bound or ~11 memory-bound environments per node |
The provisioning time and CPU figures are historical observations, not repeated benchmark results. The capacity figures are calculations based on current resource requests and node allocatable capacity, not results from a concurrent load test.
The Original Provisioning Design
The requirement was straightforward: adding a client to Git should provision an isolated evaluation environment without an engineer manually creating Kubernetes resources.
Each environment needed its own application stack, supporting services, configuration, secrets, and HTTPS. Some prospects retained their environments for weeks and occasionally used real data, making isolation and persistence as important as provisioning speed.
We built the workflow around three components:
- ApplicationSets generated Argo CD Applications from each client’s configuration, so one config entry became one environment definition.
- Helm rendered the actual Kubernetes resources from that definition, turning templates into concrete manifests.
- Argo CD reconciled the cluster toward the desired state declared in Git, applying whatever the manifests described.
The provisioning flow looked like this:
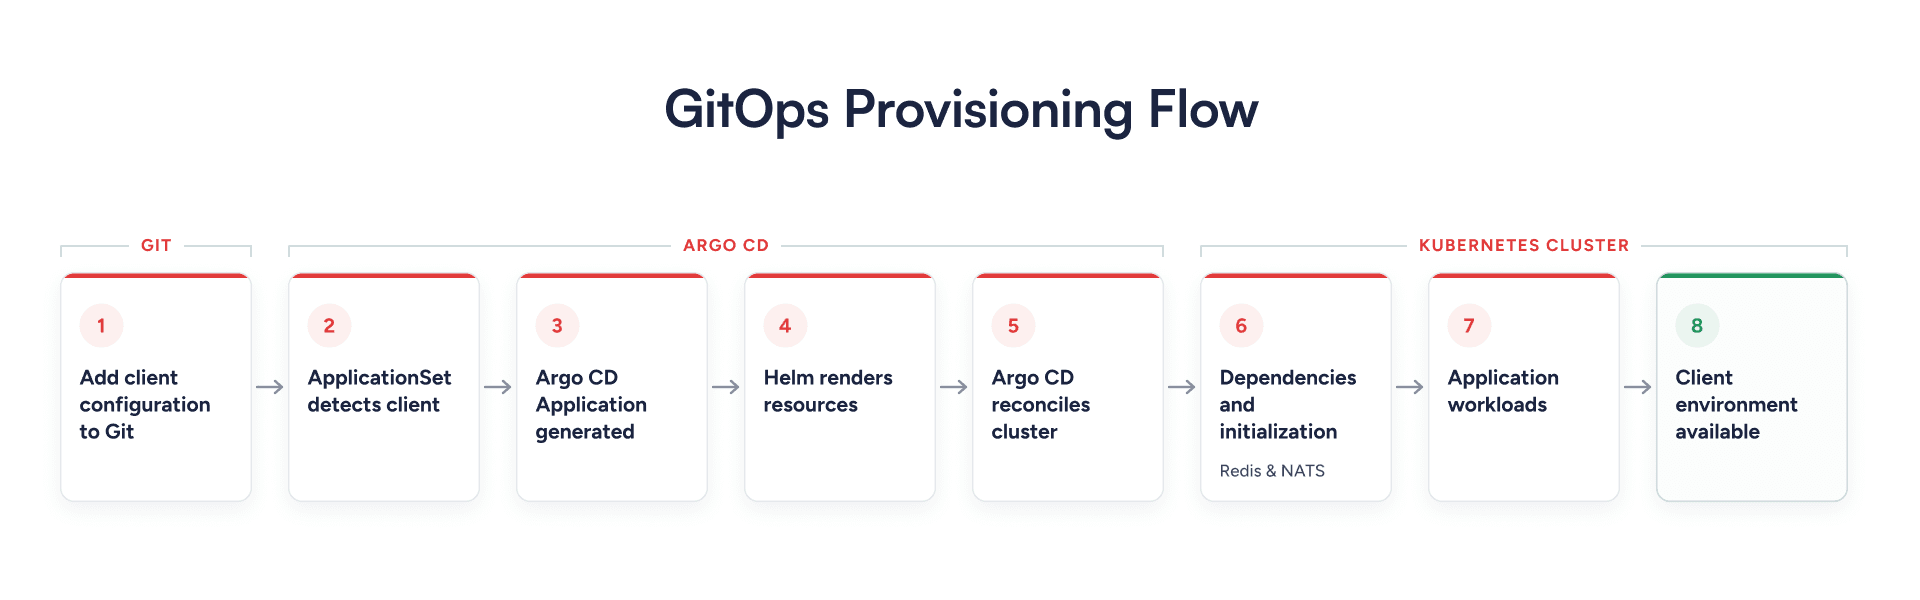
This removed manual provisioning, but it didn't guarantee that dependencies were ready, configuration changes were compatible with existing tenants, or a running application was functionally correct.
Those gaps became apparent as we operated the platform. They fall into four areas, and the rest of this article works through them in order.
1. Ordering the Resources Was Not the Same as Them Being Ready
Getting the resources to come up in the right order turned out to be easier than getting each one to actually be usable when the next one needed it. Two separate failures made that distinction clear, and a third showed that recovery had the same problem.
Database Migrations Ran Before the Database was Ready
Our initial database migration used a pre-install hook that assumed the database would already be available. Sometimes the database was still starting when the migration tried to connect. The resource existed, but that did not mean it was accepting connections.
We replaced the implicit, hook-based ordering with explicit Argo CD sync waves, which run groups of resources in a numbered sequence rather than all at once:
# Dependencies
argocd.argoproj.io/sync-wave: "0"

# Migrations and initialization
argocd.argoproj.io/sync-wave: "1"

# Application workloads
argocd.argoproj.io/sync-wave: "3"
This established the intended sequence: dependencies first, migrations and initialization next, and application workloads afterward.
However, sync waves control resource ordering; they don't independently guarantee that a database is ready to accept connections. Argo CD's progression also depends on resource health assessment and hook behavior.
A database can exist and still be unavailable. Resource creation and dependency readiness are different conditions.
Redis and NATS Introduced Another Startup Race
We encountered a more persistent version of this problem in the knowledge-service and parsing-service.
Our production incident notes document two client environments where these services encountered ECONNREFUSED while connecting to Redis and NATS. Their readiness endpoints continued returning HTTP 503 for more than three minutes.
The immediate workaround was to delete the affected pod manually.
The important detail was that sync waves had already placed Redis and NATS before the application workloads. Ordering alone had not prevented the race.
The problem exposed two separate concerns:
- The application could start before its dependencies accepted connections.
- The application's recovery behavior did not restore readiness as expected after the failed connections.
We introduced a wait-for-redis-nats init container across 23 Deployments. It waits for TCP connectivity before allowing the application container to start.
The distinction matters: sync waves control ordering; startup guards check connectivity.
Neither replaces functional validation. An open TCP port doesn't guarantee that a database can execute queries or that a broker can process messages. The init-container gate addresses startup timing, while application-level recovery must handle dependencies becoming unavailable after startup.
The failure and mitigation can be understood as two different startup paths:
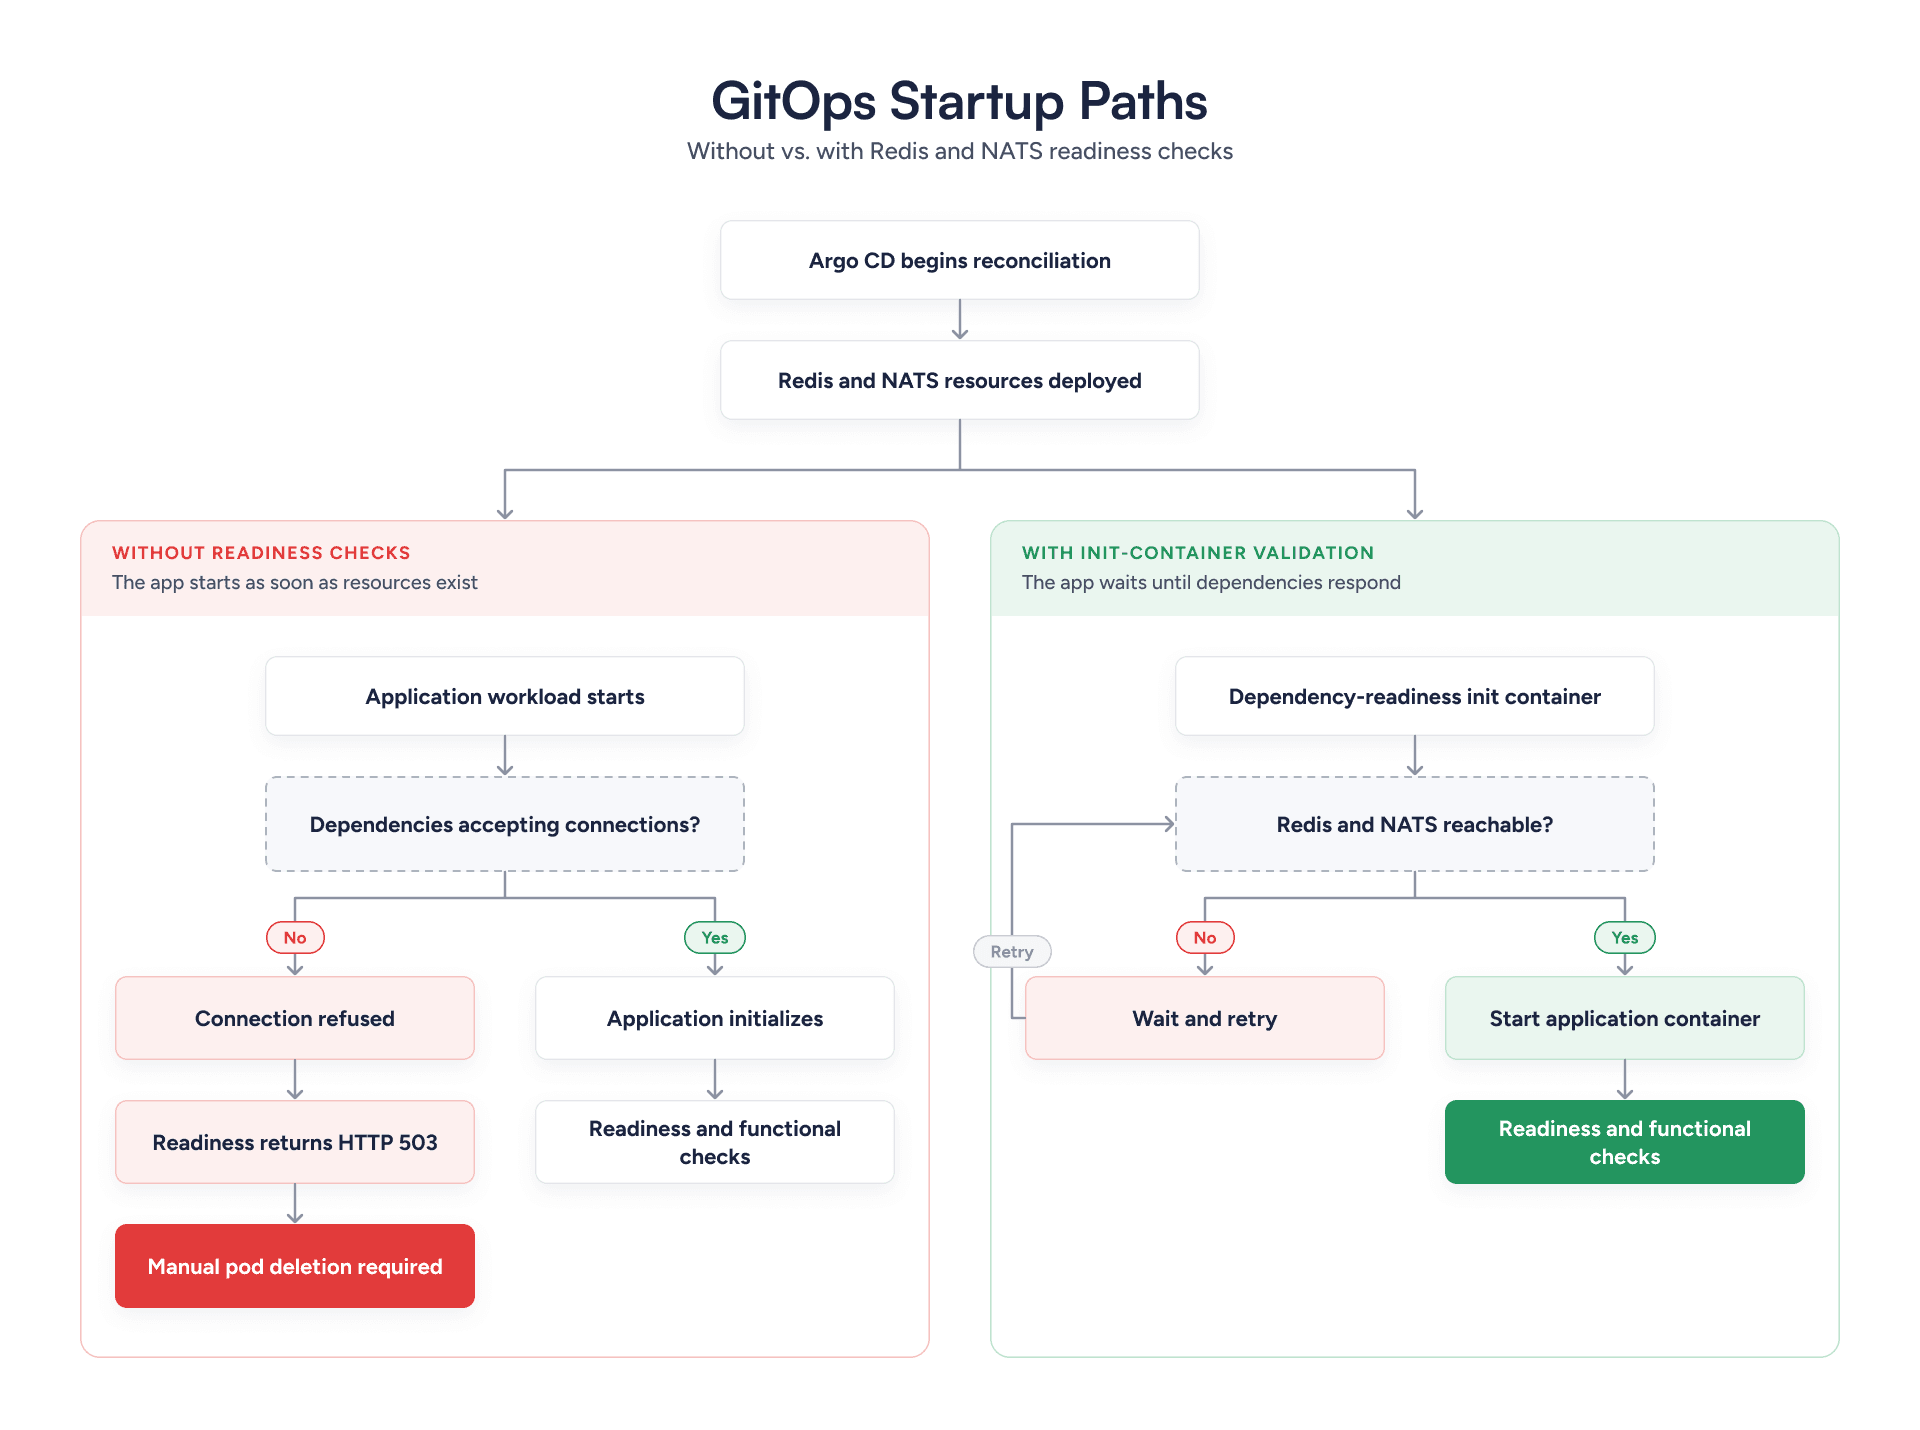
Deployment ordering and dependency readiness address different failure modes. Sync waves establish resource order; the init-container gate waits for TCP connectivity before the application starts.
What the Evidence Establishes
The production incidents demonstrate that the startup race occurred and that manual intervention was needed. The implementation record documents the subsequent connectivity gate.
They do not provide a controlled before-and-after comparison, repeated test runs, or a measured change in deployment success rate. We therefore treat this as an operational incident and an implementation change, rather than a quantified reliability benchmark.
That distinction matters when evaluating infrastructure improvements: a real failure and a plausible fix are valuable engineering evidence, but they are not the same as a controlled experiment.
Migration Jobs Needed a Safe Recovery Strategy
Existing Kubernetes Jobs couldn't always be updated and rerun in the way our deployment workflow required.
For affected Jobs, we used Argo CD's Replace=true and Force=true sync options to allow replacement and recreation rather than relying on ordinary updates.
Force replacement can delete and recreate a Job, causing its work to execute again. For database migrations, that is safe only when the operation is repeatable or has a deliberate recovery procedure.
These flags don't make a migration idempotent. They change how resources are managed, not whether the work they perform can safely run twice.
The lesson was that deployment recovery must account for the work a resource performs, not just whether Kubernetes can recreate it.
Ordering and recovery dealt with resources coming up in the wrong sequence. The next set of failures came from the opposite direction: changes that applied cleanly and still broke environments that were already running.
2. A Configuration Change Could Break Existing Tenants
A change that worked perfectly on a fresh environment was not guaranteed to work on an old one. The platform had tenants that predated the change, and three separate incidents showed how a clean-looking update could still reach back and break them.
The Frontend Artifact Contained the Production API Endpoint
We built the frontend centrally, with the production API endpoint embedded in the generated JavaScript. The endpoint appeared 14 times across seven files in the build artifact.
Reusing that artifact in a customer environment could direct requests toward production even when the Kubernetes deployment appeared healthy.
Rebuilding the frontend for every client was cleaner, but each build took several minutes and conflicted with our roughly two-minute boot target.
We introduced a startup-time replacement mechanism that substituted the expected production endpoint with the client-specific endpoint.
The startup script first checked that the expected production string existed. If it didn't, the container refused to start.
This was a fail-closed workaround, not a complete security control. It protected against the expected string being absent, but couldn't prove that every request used the correct endpoint or rule out other hardcoded endpoints.
Runtime configuration or a properly environment-specific build would be a stronger long-term design.
The incident reinforced an important distinction: a healthy deployment doesn't prove that the application is communicating with the correct environment.
Missing Secrets Caused Nine Deployment Deadlocks
A chart change introduced a required secret or configuration value that existing client environments didn't all have.
Affected pods entered CreateContainerConfigError before the application started, leaving no useful application logs to inspect.
Argo CD waited for the workload to become healthy. The current sync could remain stuck while the fix was waiting in a later Git revision, preventing the normal deployment workflow from applying the change needed to resolve the problem.
We encountered this pattern nine times.
We changed our deployment discipline: whenever a chart introduced a new required secret key, we updated existing client configurations in the same commit. We used ./scripts/reseal-all.sh to reseal the key across existing tenant configurations.
This made the chart change and its required configuration part of the same change set.
A chart that works on a fresh installation can still break every existing tenant, so backward compatibility had to become part of the deployment process.
Tenant Isolation Required Deliberate Trade-offs
We chose a namespace-per-client model, with separate application workloads and supporting services such as databases and caches.
We kept cleanup manual because deleting an environment during an active customer evaluation was considered worse than paying for an unused one. The trade-off was that abandoned environments could continue consuming resources.
Later, we separated development and production at the cluster level. Namespace separation alone wasn't enough to protect production from an operator accidentally running a destructive command against the wrong cluster.
Namespaces remained one layer of isolation, not a complete security boundary. RBAC, secret access restrictions, network policies, and other controls still needed to match the threat model.
3. A Successful Deployment Did Not Guarantee a Working Integration
Kubernetes can report a workload as healthy and Argo CD can report it as synced while the thing the workload is supposed to connect to is still broken. As the platform grew past 20 services, the gap between “deployed” and “actually working” became its own class of problem.
Certificate Issuance Became a Bottleneck
Initially, we issued certificates per client. As environment provisioning became more frequent, certificate authority rate limits became a constraint.
We moved first to a manually issued wildcard certificate, then to automated wildcard issuance using cert-manager with DNS-01 validation. Certificate material was propagated into individual client namespaces.
Each step traded one risk for another. The manual wildcard certificate eased the immediate issuance bottleneck but introduced renewal risk, since a human had to remember to renew it. Moving to cert-manager automated renewal and cut the manual work, while adding dependencies on the certificate controller, the DNS automation, its credentials, and secret propagation.
Reliable certificate management takes more than successful issuance. Expiration, renewal status, propagation, and the certificate actually served to the client all have to be accounted for.
Deployed Integrations Weren't Always Working Integrations
As the platform grew to more than 20 services, we encountered problems that weren't obvious from deployment status.
One configuration path could request broader Google permissions than intended. In another case, credentials existed but weren't wired into the service that needed them.
We changed calendar and Gmail permissions to be opt-in per client and became more deliberate about verifying that credentials were connected to the components that depended on them.
Three states are easy to conflate:
- The credential exists.
- The service is running.
- The feature works as intended.
Each requires its own validation. Kubernetes health and Argo CD synchronization are useful signals, but they aren't substitutes for functional checks of external integrations.
The broader lesson was that configuration must be traced all the way from the source of truth to the component that consumes it.
4. Resource Allocation Was Limiting Capacity Unnecessarily
The cluster had CPU to spare and was still blocking work. The limits we had set to keep any one client in check were doing their job too aggressively, and fixing that meant first understanding what the environments actually consumed, then recalculating capacity from the current configuration rather than an old assumption.
Namespace Quotas Blocked Migrations despite Available CPU
We introduced namespace quotas to prevent one client environment from consuming too much of the cluster.
Once several services were running in a namespace, that quota started blocking migration Jobs, even though actual CPU consumption looked low against the reservations.
A historical resource observation recorded approximately 39 millicores of CPU usage against 1,230 millicores reserved. The original record did not preserve the raw command output, an exact measurement timestamp, or repeated samples. It also contained an unresolved inconsistency, with another sentence referring to 1,225m out of 4.
We retain the 39m and 1,230m figures as historical observations rather than treating them as a validated benchmark.
We reduced CPU requests to better reflect observed consumption, removed the namespace quota that was blocking migrations, and retained per-container limits to constrain individual workloads. The configuration included a maximum of four CPUs and 4 GiB of memory per container.
The observation helped identify a potential resource-allocation problem. It did not establish average CPU consumption over time or prove how many environments could run safely under peak load.
Recalculating Capacity Using the Current Configuration
Capacity estimates are only as accurate as the resource configuration behind them. As services are added, enabled, or resized, the total CPU and memory requests per environment change, affecting how many environments a node can accommodate.
We recalculated capacity by summing the CPU and memory requests of all enabled services in the current Helm configuration and comparing those totals against the node's allocatable resources.
The calculation uses two constraints:
- CPU-bound capacity: available allocatable CPU divided by total CPU requests per environment.
- Memory-bound capacity: available allocatable memory divided by total memory requests per environment.
The resulting estimates indicate which resource is likely to become the scheduling bottleneck first.
These figures represent theoretical capacity, not guaranteed production limits. They do not fully account for workload bursts, operational headroom, scheduling constraints, or actual runtime consumption. Concurrent workload testing is needed to establish practical capacity under real operating conditions.
The key lesson is that capacity planning must follow the current configuration. Estimates derived from an earlier chart version can become stale as the platform evolves, even when the underlying infrastructure remains unchanged.
The four problems were all things that went wrong. It is worth stepping back to the thing that went right, and being just as precise about what that result does and does not prove.
Provisioning an Environment in About 110 Seconds
The platform's README records a cold-provisioning observation of approximately 110 seconds, measured from a Git push until Argo CD reported the environment as Synced+Healthy, starting with an empty namespace.
This demonstrates that the ApplicationSet discovery, Helm rendering, and Argo CD reconciliation workflow could provision an environment without manually creating Kubernetes resources.
The available record describes one measured run. It does not include raw timestamps, a sample count, or a script that reproduces the timing. We therefore present 110 seconds as a recorded cold-provisioning observation, not a guaranteed provisioning time or a statistical performance result.
It is also important to understand what the endpoint represents. Synced+Healthy describes Argo CD's view of the managed resources; it does not independently establish that every application feature, external integration, or customer workflow is functioning correctly.
A complete environment still needed its dependencies, secrets, configuration, certificates, and integrations to work as intended.
Reducing the time to create Kubernetes resources was useful. Making the resulting environment dependable was the harder engineering challenge.
Each section so far has paired a finding with a note on how strong the evidence behind it is. Gathered in one place, that honesty becomes its own point: not every improvement here is backed by the same kind of proof, and it helps to see exactly which is which.
What the Implementation Shows, and What Stays Unmeasured
The platform gave us concrete operational evidence about several failure modes. Not every improvement, though, is backed by a controlled benchmark, and the table below sorts each finding by the kind of evidence behind it.
Finding | Evidence available | What it establishes |
|---|---|---|
Dependency startup race | Two documented client incidents with connection refusals and prolonged HTTP 503 readiness | The failure occurred in production |
Redis/NATS connectivity gate | Implementation across 23 Deployments | The startup guard was introduced |
CPU utilization versus reservations | One historical | A potential resource-request mismatch |
Cold provisioning | One recorded run of approximately 110 seconds | The workflow completed within that observed time |
Current node capacity | Live node allocatable resources and current chart requests | A reproducible theoretical capacity calculation |
We have not run a controlled A/B experiment comparing dependency startup with and without the readiness gate. The production incidents were uncontrolled observations, not repeated tests under identical conditions.
That means we cannot quantify the gate's effect on startup success rate, median time to readiness, or recovery time from the available records.
A minimal isolated test with a deliberately delayed Redis or NATS dependency would be the next step to quantify that improvement. Such a test should record repeated runs with and without the gate and preserve the actual output.
The same principle applies to capacity. The current calculation is useful for planning, but concurrent workload testing would be necessary to validate a production operating limit.
Distinguishing these evidence levels is part of the engineering discipline: historical observations, calculations, and controlled experiments answer different questions.
Why We Stopped Trusting “Deployed” as “Done”
Four habits carried across the incidents, and each one came directly from a failure above. They share a single idea: a clean deployment is a claim about the system, not proof the system works, so each habit is a way of checking what the deployment status does not.
1. We Evaluated Changes Across the Entire Environment.
A chart change could require a secret update; a service change could affect an integration; and certificate automation could introduce DNS and credential dependencies.
2. We Separated Deployment Status from Application Correctness.
A successful sync didn't prove that a database was reachable, a frontend targeted the right API, or an integration worked.
3. We Designed for Recovery.
A workflow needed a way to apply a fix when a resource was stuck, and a Job replacement strategy needed to account for whether its work could safely run again.
4. We Kept the Resource Model Current
A capacity estimate built on an older chart grows misleading as services and their requests change, so the model has to be recalculated against the configuration actually running.
These weren't isolated bugs. They exposed recurring assumptions about dependencies, configuration, resource allocation, and the lifecycle of existing environments.
A Reproducible GitOps Reference You Can Start From
We created a public reference repository to demonstrate the GitOps provisioning pattern without exposing proprietary project configuration:
GitHub: gitops-environment-provisioning-template
The repository illustrates the core provisioning structure, including client discovery through ApplicationSets, a shared Helm chart, and deployment configuration.
It provides a starting point for engineers exploring how to organize a GitOps-driven environment provisioning workflow.
The implementation makes the desired state explicit. The operational lessons show why that is not sufficient on its own: dependencies need readiness checks, configuration changes must account for existing tenants, and recovery procedures must respect the work performed by each resource.
The historical production incidents and resource observations described in this article come from the original platform's operational records. The repository is a public reference implementation, not a claim that the original production environment or all its measurements can be reproduced from the template.
What “Push to Deploy” Actually Meant
We started with a simple requirement: add a client to Git and provision an environment without manually creating Kubernetes resources.
We got that flow working. The harder work was making it predictable when a database wasn't ready, a broker was still starting, a secret was missing, a certificate needed renewal, or a configuration change broke an existing tenant.
GitOps gave us a way to declare and reconcile the desired state. It didn't remove the need to understand runtime behavior, security boundaries, resource consumption, integration correctness, or recovery.
Our production incidents showed where the initial assumptions failed. Our resource analysis showed why capacity calculations must follow the current configuration. And our provisioning observation demonstrated that the core workflow could complete in roughly 110 seconds under the recorded conditions.
The remaining challenge is to turn those operational improvements into repeatable measurements that quantify their impact.
Reliable provisioning came from three things: making dependencies explicit, being honest about the limits of our evidence, and designing around how the system actually behaved rather than how we expected it to. That was the real work behind “push to deploy.”
This Kind of Work Is Its Own Discipline.
Building provisioning that stays reliable once real environments depend on it, dependency ordering, backward-compatible configuration, recovery that respects each resource, and capacity that tracks the live chart, is the work GeekyAnts does through its DevOps engineering practice, which covers CI/CD, Kubernetes, infrastructure as code, observability, and production reliability.