May 30, 2024
Anomaly Detection in Elasticsearch
In our latest blog, navigate how to set up anomaly detection in Elasticsearch using the API. Gain flexibility, seamlessly integrate with your workflows, and automate tasks efficiently.
Author


Book a call
Table of Contents
Anomaly detection plays a pivotal role in uncovering unusual patterns within data that could signify critical issues like fraud, network intrusions, or system failures.
Anomaly detection jobs in Elasticsearch can be set up through two primary methods: using Kibana's user-friendly interface or leveraging the Elasticsearch API directly. While Kibana provides a convenient graphical interface for configuring anomaly detection jobs, offering intuitive controls and visualizations, setting up jobs via the Elasticsearch API grants users greater flexibility and control over the process. In this blog, we focus on the latter approach, utilizing the Elasticsearch API to demonstrate how anomaly detection jobs can be configured programmatically. This method allows for seamless integration with existing workflows and automation pipelines, empowering users to tailor anomaly detection to their specific use cases and requirements with precision and efficiency.
Please note - a valid machine learning license is required for using AI Jobs like anomaly detection in Elasticsearch. Ensure licensing compliance before configuring anomaly detection or other AI-driven tasks. You can obtain a license from the Kibana or activate a trial license if you just want to explore the capabilities.
Getting Started
Let us assume we have the data of students’ test results and want to run anomaly detection on the test results partitioned by subject_id.
Step 1: Create An Anomaly Detection Job
To create an anomaly detection job using the Elasticsearch Console, you would typically use the PUT method along with the _ml/anomaly_detectors/<job_id> endpoint. Here is how you can structure the request:
Crafting a PUT request to instantiate an anomaly detection job in Elasticsearch involves meticulous configuration within the request body. At the core of this configuration lies the analysis_config object, which delineates the methodology for data analysis. Within this pivotal object, two critical properties come to the forefront: bucket_span and detectors.
Analysis Configuration
Bucket Span:
The bucket_span parameter dictates the temporal granularity of the analysis aggregation. This interval, often denominated in time units like minutes or hours, serves as the foundational unit for anomaly detection. Crucially, the bucket_span should align with the inherent characteristics of the data and ideally be divisible by the datafeed's aggregation interval if applicable. For instance, a typical range for bucket_span spans between 5 minutes and 1 hour, with recommendations emphasizing whole numbers of days or buckets within a day for optimal performance.
Detectors Array:
Embedded within the analysis_config object, the detectors array assumes a central role. This array encompasses configuration objects that articulate the specifics of anomaly detection. Each detector configuration delineates the field to be scrutinized (field_name), the analytical function to be applied (function), and optionally, a segmentation field (partition_field_name). Furthermore, the detector_description furnishes a human-readable descriptor of the detector's intent, facilitating comprehension and documentation.
By meticulously orchestrating the request body with these intricate components, Elasticsearch gains invaluable insights into how to interpret and process incoming data for anomaly detection purposes. The analysis_config serves as a blueprint for the overarching analysis strategy, while the detectors array empowers users to craft multiple detection configurations tailored to the idiosyncrasies of their dataset. This modular framework not only ensures adaptability but also affords granularity in anomaly detection setups, accommodating a diverse array of use cases and datasets with finesse and precision.
Data Description
Within the anomaly detection job setup, the data_description object assumes a crucial role in defining the structure of the input data. This section serves as a guide for Elasticsearch to interpret incoming data streams accurately for anomaly detection purposes.
format
(string) Only xcontent format is supported at this time, and this is the default value.
time_field
(string) The name of the field that contains the timestamp. The default value is time.
time_format
(string) The time format, which can be epoch, epoch_ms, or a custom pattern. The default value is epoch, which refers to UNIX or Epoch time (the number of seconds since 1 Jan 1970). The value epoch_ms indicates that time is measured in milliseconds since the epoch. The epoch and epoch_ms time formats accept either integer or real values.
Model Plot Configuration
The model_plot_config object, while optional, offers advanced settings for storing model information alongside results, enhancing the granularity of anomaly detection analysis.
Annotations Enabled:
The annotations_enabled property, a Boolean value, determines whether calculation and storage of model change annotations are enabled for each entity under analysis. By default, this feature is enabled unless specified otherwise.
Enabled:
The enabled property, also a Boolean value, dictates whether calculation and storage of model bounds for each entity being analyzed are enabled. By default, this feature is disabled but can be activated as needed for a more detailed view of anomaly detection results.
Results Index Name
The results_index_name property, though optional, allows customization of the machine learning results index name. By default, this property is set to "shared," resulting in the generation of an index named .ml-anomalies-shared. However, users can specify a different text string to tailor the index name according to their preferences or organizational requirements.
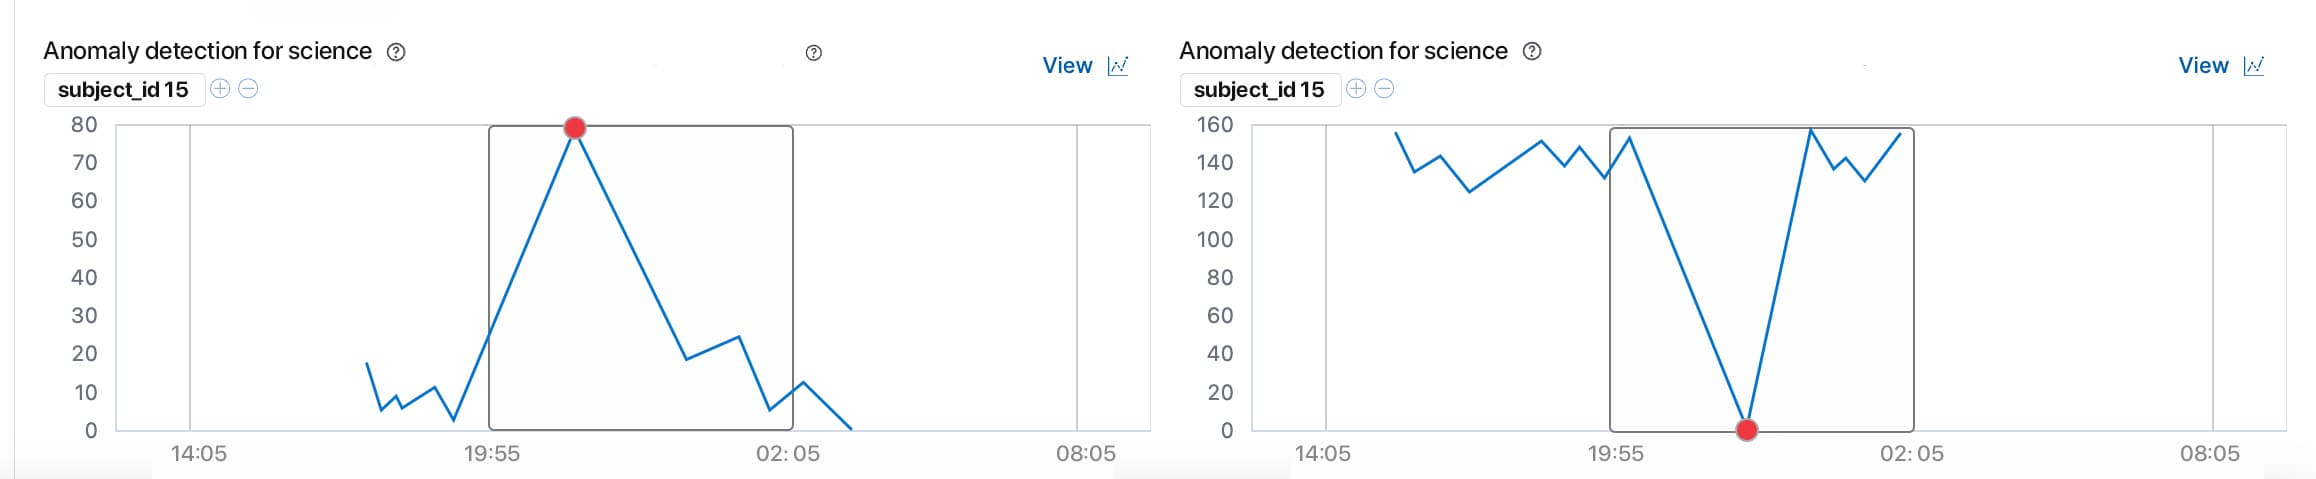
Here is an example of one such detection job configuration :
The above configuration has two detectors one for the max of a value and the other is the min of a value. The detection results can also be split based on the partition_field_name value. The time_field mentioned in the data_description will be the time value used to plot the data in which an anomaly would occur. A time_series data is a must as anomaly detection will only detect the anomalies over a period of time.
Step 2 : Create a Datafeed
To create a datafeed in Elasticsearch, you will use a PUT request with the _ml/datafeeds/<feed_id> endpoint. However, before creating a datafeed, ensure that you have already set up an anomaly detection job. Additionally, you will need the following privileges: cluster: manage_ml (granted by the machine_learning_admin built-in role), and the source index configured in the datafeed must have the read privilege.
To open the anomaly detection job and start the datafeed in Elasticsearch, you will need to send a POST request to the respective endpoints. Here is how you can do it:
Step 3: Open Anomaly Detection Job
Replace <job_id> with the identifier of your anomaly detection job. This request will open the specified job for analysis.
Step 4: Start Datafeed
Replace <feed_id> with the identifier of your datafeed. This request will start the specified datafeed for ingesting data and running anomaly detection.
Execute these requests sequentially in Elasticsearch, ensuring that your anomaly detection job and datafeed are properly configured and ready for analysis. Once opened and started, the job will begin analyzing incoming data for anomalies.
Results
There are two ways to view the results of an anomaly detection job. We have the Kibana to view the results and we have some results API endpoints.
The Kibana is a better option as it has all the GUI required to better understand the results of the anomaly detection job.
There are a few API endpoints which give us particular details:
Get buckets API :
The get buckets API presents a chronological view of the records, grouped by bucket.
Get overall buckets API :
By default, an overall bucket has a span equal to the largest bucket span among the specified anomaly detection jobs. To change this behavior, you can use the optional bucket_span parameter. For more information on buckets, see the Buckets documentation.
The overall_score is calculated by combining the scores of all the buckets within the overall bucket span. First, the maximum anomaly_score for each anomaly detection job in the overall bucket is determined. Then, the top_n of these scores are averaged to produce the overall_score. This allows you to fine-tune the overall_score to be more or less sensitive to the number of jobs detecting an anomaly simultaneously. For instance, setting top_n to 1 means the overall_score will be the maximum bucket score in the overall bucket. Conversely, setting top_n to the total number of jobs means the overall_score will be high only when all jobs detect anomalies in that overall bucket. If you set the bucket_span parameter to a value greater than its default, the overall_score will be the maximum overall_score of the overall buckets with a span equal to the largest bucket span of the jobs.
Get records API :
Records contain the detailed analytical results, describing the anomalous activity identified in the input data based on the detector configuration.
Depending on the characteristics and size of the input data, there can be numerous anomaly records. Often, there are too many to process manually. To manage this, the machine learning features perform a sophisticated aggregation of anomaly records into buckets.
The number of record results depends on the anomalies found in each bucket, which is influenced by the number of time series being modeled and the number of detectors used.

Summing Up
Anomaly detection is essential for identifying irregular patterns that may signal issues like fraud or system failures. Configuring anomaly detection jobs in Elasticsearch can be done via Kibana's interface for ease of use or the Elasticsearch API for more flexibility.
This article focused on using the Elasticsearch API to set up anomaly detection, covering the creation of jobs, datafeed setup, and starting the processes. Important configuration elements like bucket_span and detectors were highlighted.
Results can be viewed through Kibana for a user-friendly experience or via specific API endpoints for detailed information.
By following these guidelines, users can effectively utilize Elasticsearch's machine learning capabilities for precise anomaly detection. Ensure you have the necessary machine learning license before starting.
For more information, check here.
Subscribe to Our Newsletter
Subscribe to RSS
Press & Media Hub RSS FeedRelated Articles.
More from the engineering frontline.
Dive deep into our research and insights on design, development, and the impact of various trends to businesses.

Jul 10, 2026
How We Built the Missing Bridge from Code to Figma

Jun 27, 2026
Building a Resilient Hybrid-Cloud Network with WireGuard HA, Route-Based Failover, and Deep Observability

Jun 19, 2026
We Built a 114-Second AWS-to-Azure Failover. Here’s What We Learned

Jun 12, 2026
Cloud-Native and Cloud-Agnostic Are Not Ideologies; They Are Business-Stage Decisions

Jun 8, 2026
Geeklego: The Open-Source Design System Built to Work With AI

May 18, 2026