Aug 21, 2024
Remote debugging in Heroku
Discover how to easily set up remote debugging for your Node.js app on Heroku, and diagnose issues like a pro with our step-by-step guide!
Author


Book a call
Table of Contents
Hey there, fellow coder! Have you ever wished you could just step through your Node.js app running on Heroku like a local app? Well, grab your favorite drink and get comfy because we’re about to embark on a fun journey to set up remote debugging on Heroku!
Why Remote Debugging?
Debugging is a crucial part of development, ensuring your app runs smoothly and efficiently. Remote debugging is especially important when your app is deployed on a server, allowing you to diagnose issues that only appear in a deployed environment.
Prerequisites
Before we jump in, make sure you have:
- A Node.js application deployed on Heroku.
- The Heroku CLI installed on your machine.
Debugging Steps
Step 1: Enable Remote Debugging
First, we need to enable remote debugging for your Node.js app. Heroku uses the inspect flag to allow remote debugging.
- Modify Your
Procfile: Add the--inspectflag to yourProcfile. It should look something like this:
2. Deploy Changes to Heroku: Commit your changes and push to Heroku:
Step 2: Open a Remote Debugging Session
Now that your app is configured, it’s time to connect to the remote debugger.
- Restart Your Heroku App: Restarting ensures the
inspectflag is applied:
2. Forward Debugging Port: Forward traffic on a local port to a port inside a dyno; in this case both the local port and dyno port are 9229:
Step 3: Connect Your Debugger
With the SSH tunnel set up, you can now connect your favourite debugger.
Using VS Code
- Open VS Code: Launch VS Code and open your project.
- Configure Debugger: Add a new configuration in your
launch.json:
3. Start Debugging: Select the "Attach to Heroku" configuration and start debugging. Set breakpoints, inspect variables, and step through your code like in a local environment.
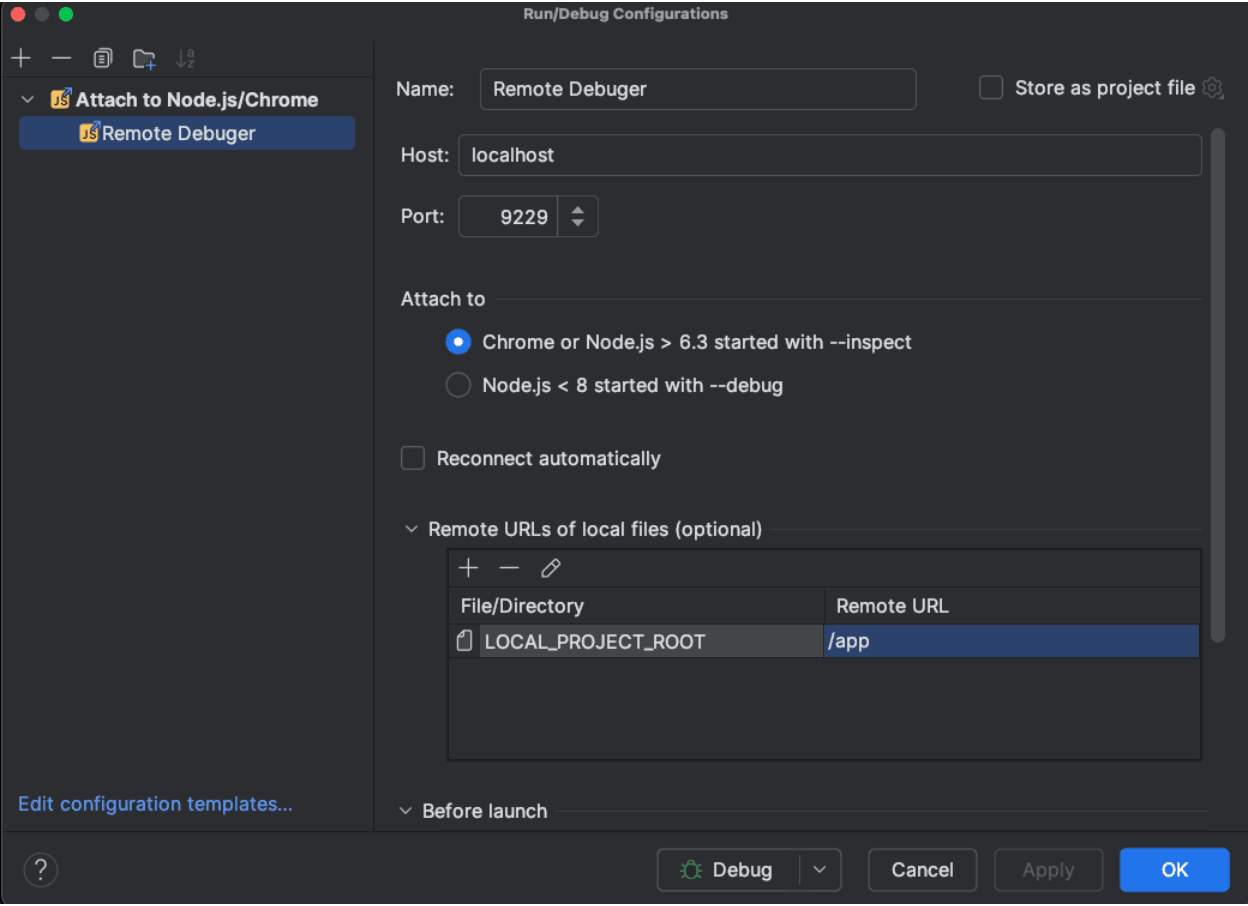
Using IntelliJ IDEA / Webstorm
- Open Run Config: Open your IDE and go to
Run > Edit Configurations. - Configure Debugger: Click the
+button and selectAttach to Node.js/Chrome:

3. Start Debugging: Select your newly created Node.js Remote Debug configuration, Click the debug icon and start debugging. Set breakpoints, inspect variables, and step through your code like in a local environment.
And there you have it! You’ve just set up remote debugging for your Node.js app on Heroku. High five! Debugging in the cloud just became a whole lot cooler, right? If you hit any bumps along the way, double-check your SSH tunnel and configurations. Happy debugging!
Related Articles.
More from the engineering frontline.
Dive deep into our research and insights on design, development, and the impact of various trends to businesses.

Apr 23, 2026
From Manual Testing to AI-Assisted Automation with Playwright Agents
This blog discusses the value of Playwright Agents in automating workflows. It provides a detailed description of setting up the system, as well as a breakdown of the Playwright Agent’s automation process.

Apr 14, 2026
The Keyboard Bounce of Death: Handling Inputs on Complex React Native Screens
Fix the React Native ‘Keyboard Bounce of Death.’ Learn why inputs jump and how to build smooth, production-ready forms with modern architecture.

Apr 9, 2026
From RFPs to Revenue: How We Built an AI Agent Team That Writes Technical Proposals in 60 Seconds
GeekyAnts built DealRoom.ai — four AI agents that turn RFPs into accurate technical proposals in 60 seconds, with real-time cost breakdowns and scope maps.

Apr 6, 2026
How We Built an AI System That Automates Senior Solution Architect Workflows
Discover how we built a 4-agent AI co-pilot that converts complex RFPs into draft technical proposals in 15 minutes — with built-in conflict detection, assumption surfacing, and confidence scoring.

Apr 6, 2026
AI Code Healer for Fixing Broken CI/CD Builds Fast
A deep dive into how GeekyAnts built an AI-powered Code Healer that analyzes CI/CD failures, summarizes logs, and generates code-level fixes to keep development moving.

Apr 2, 2026
A Real-Time AI Fraud Decision Engine Under 50ms
A deep dive into how GeekyAnts built a real-time AI fraud detection system that evaluates transactions in milliseconds using a hybrid multi-agent approach.