Asset Management Dashboard App For A Manufacturing Giant
Developing an Asset Management Dashboard for a Fortune 500 company


About the Client
Data plays a critical role in effective management today, be it any industry or vertical. With increased competition and customers expectations rising, the manufacturing sector is under immense pressure and is being forced to seek new ways to boost its bottom lines and meet customer’s demands through faster supply at lower costs. Now, more than a 100-year-old, the client is a Fortune 500 company, holding the position for the last 24 years and still counting. The client is multinational corporation headquartered in Switzerland, operating mainly in robotics, heavy electrical equipment, automation and technology verticals.
The Problem
The client came up with the idea to gain an edge over their competitors by employing effective data management and deploying similar solutions for their partners in the Heavy Industries unit. The idea was to improve manufacturing processes using data in the world that is in a state of VUCA (volatility, uncertainty, complexity, and ambiguity). They wanted to utilize big data and IoT from sensors to track and manage Manufacturing plants.
They reached out to us in 2019 while looking for an experts in React JS for their Plant Asset Management project. They looked at our profile and the work that we have showcased in our Case Studies. They were impressed by what we offered and got into discussions with us. After a detailed discussion about requirements, expectations and dependencies, we gave them a ballpark plan based on the Time & Material engagement model. They liked the plan and agreed to the engagement. With the web app, we were also engaged in building a mobile app for the same purpose. The project was officially kicked off in January, 2020.
Development
Plant Asset Management System is based on remote monitoring as well as controlling. This requires a Microcontroller being used to collect real time data from different Equipments/Assets/Machines in a plant and accurately reflect their status.
As decided by the engagement model, this project was divided into a total of 4 phases, lasting a total of 11 months. As previously decided by the client, since the majority of the work was in Frontend, the tech stack of choice was React JS with MobX, as many of their POCs had been done using the same technology and there was a great level of trust in it. It was an obvious choice to develop the related mobile application in React Native, given the common roots and the dense community support that comes with it.
The first step in the process was to design the look of the web app as well as the mobile app. The design team took into consideration the user base and their familiarity with technology to make it easy to use and understand. Alongside the web app, the mobile app was also being designed to accurately represent that data that the web app would deal with and showcase, with the added emphasis on mobility and quick access.
For the backend, the client emphasised on the usage of Node JS and Dot Net for communication and commonality across their multiple POCs.
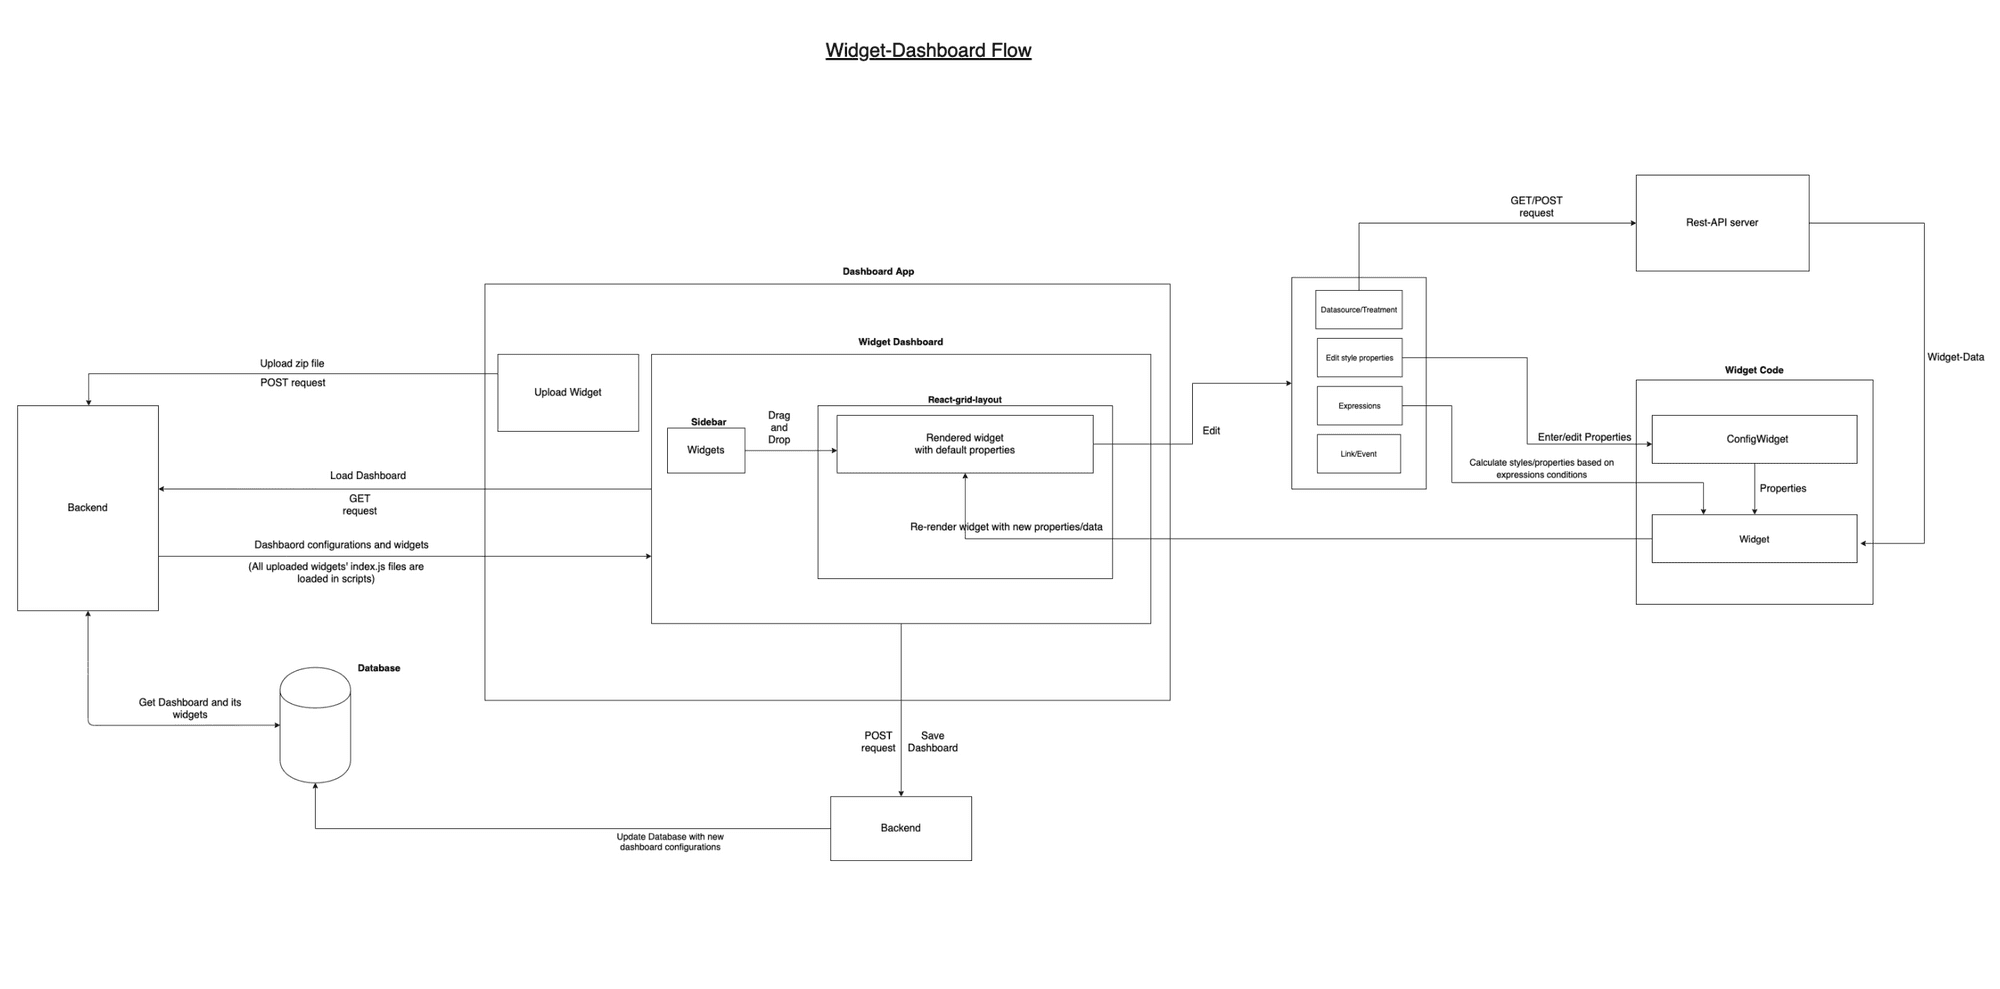
The functionality of the dashboard was envisioned to be very straightforward. It would have a homepage with the recent summaries from different widgets, widget tabs to switch from and to and logs that record the condition of the different assets under supervision. These were the features that were implemented in the first few phases of the development phase. As the project grew, new features were introduced in the mix. Multiple views for multiple dashboards vere introduced for different user levels. Charts for trends and health status (Ring/Line Charts) were built into the dashboard for better visual representation of data. A Label widget was created for reading multiple sources (multiple equipments) for data. Also, customizability was an important feature that was inculcated through additions of filters, grids and a link functionality that allowed multiple dashboards to be linked together.
Parallely, similar features were being developed for the mobile app in React Native. A lot of code was reused and the mobile app was developed to be responsive.
Alongside development, the product was put through multiple levels of rigorous manual testing to reinstate confidence in every function of the app and sort out bugs that needed to be fixed. The client was kept in the loop through every stage. The apps were first put through a developer level test round and were also put through an intense User Acceptance Testing phase where the end-user tested the product upto satisfaction and reported any discrepancies, if found which were fixed in the following sprints.
Overcoming Challenges
With an application of such a scale and delicate details, challenges and roadblocks are bound to come across during its development, but it was nothing a little R&D couldn't solve. While implementing responsiveness for the web app, maintaining widget coordinates was a challenge, which was solved by some basic mathematics. Because similar configurations were to be applied in a lot of different widgets (like subscribing events, resolving expressions etc.), these configurations were modularized for reusability. The configurations and the dashboard were dynamic in nature, which made testing complex. It did take some effort to streamline tests but in the end, the product was thoroughly tested. Code sharing was also difficult as it was manual, which created some conflict but was resolved quite early in the project.
In bird's eye view
- CI/CD was done using Azure DevOps
- Tasks were handled using Trello and Jira
- All communication was done through Slack, Email & Google Meet.
Final Impression
Based on the quality of the project that was delivered, the client has nothing but praises for us. During the entire course of the project, the client has appreciated the professionalism and the punctuality of the team members. We have even received an amazing acknowledgement from the client's R&D division as well. The client has put their trust in us with more projects and we are currently working on them as well. We hope to retain this long term relationship with the client and collaborate with them in the future.
Team On-Call
Understanding the complexity and duration of the project, a team of 7 members were tasked to take this responsibility and deliver quality at the drop of a dime. Following the agile methodology, the team involved was engaged in daily scrum meetings and daily updates were given to the client on call. With the team introduced to the client and the requirements set in place, the team got cracking at the project.
A web dashboard with customizable and resizable widgets to display data.
A web dashboard with customizable and resizable widgets to display data.
Communication between IoT devices and the web dashboard to display and record accurate real-time data.


OUR APPROACH
We followed a structured and collaborative development approach focused on strategy, user experience, scalable development, and continuous testing. From initial planning to final delivery, every phase was designed to ensure a seamless product experience, faster development cycles, and successful MVP deployment within the project timeline.
- The goal being to improve the manufacturing processes of a company through data management solutions, we collaborated with the client engaging in a time and material model over the course of eleven months.
The Right Conversation Can Save You Six Months
Contact us
More from our engineering work

Fuel and Fleet Management Platform
We built a fleet management platform with mobile applications that enable real-time tracking, fuel monitoring, and operational visibility for fleet operators.
Read case study
How Supply Dome Transformed EV Supply Chains with Advanced App Solutions
Discover how Supply Dome simplified production management for a leading manufacturer or EV vehicles. Explore the key features, development phases, and impact on operational efficiency.
Read case studySustainability & Construction: Reduzer
GeekyAnts modernized this construction management web app using tools like Algolia and Speckle to improve efficiency.
Read case studyWeb app for a Custiv
Improving the industrial sector by enhancing the supplier side of the app
Read case studyP2P App For The @ Company
The @ Company has committed itself towards the creation of a more 'human' internet by enabling users to access the goodness of the internet, without sacrificing their privacy online.
Read case studyAsset Management Dashboard For A Railway Giant
Making maintenance accurate and immediate with IoT & state-of-the-art mobile technology for a heavy industries giant in the Railway division.
Read case study