Observability Assessment Services
We assess your monitoring stack, logging pipelines, and alerting systems to find exactly where visibility breaks down. Our cloud observability services give engineering teams a clear view of coverage gaps, alert noise, and wasted tooling spend, along with a prioritized plan to close each one.
Make Your Systems Transparent and Traceable










Most engineering teams find the gaps in their observability only after a Tier-1 incident has already escalated. Our Observability Assessment reviews your monitoring, logging, tracing, alerting, and telemetry workflows to catch those weak points before they turn into outages. We replace ad-hoc troubleshooting with structured signal pipelines that cut alert fatigue and Mean Time to Resolution (MTTR). The assessment ends with a prioritized roadmap your team can act on from Day 1.
Client Results and Success
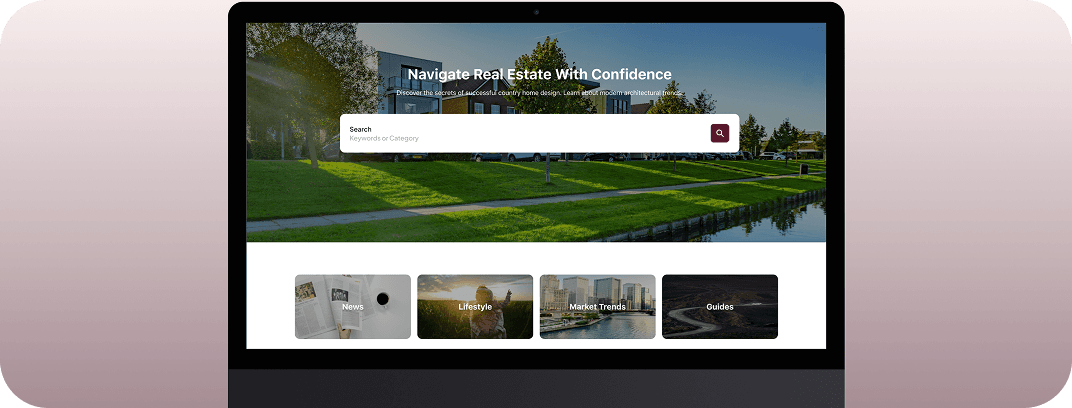
Production-Ready Kubernetes Architecture
The platform was designed to support scalable production deployments with minimal resource consumption, enabling faster environment provisioning and operational stability.
- environments K8s setup
- 3
- environments K8s setup
- 95%
- savings over managed Kubernetes alternatives
- 35%

40% Faster Onboarding Completion
The redesigned system achieved a 40% reduction in onboarding completion time, directly improving platform adoption and reducing operational bottlenecks.
- Improvement in the doctor's efficiency for treatment planning
- 35%
- Reduction in onboarding completion time
- 40%
Production-Grade AI Infrastructure
The system supports scalable AI inference and automated inspection workflows, reducing manual intervention and enabling consistent performance under growing usage.
Read case study3× Faster Feature Iteration
The platform achieved 3x faster AI feature iteration cycles, significantly reducing time-to-release for new recommendation
- Reduction in meal decision time
- 40%
- Increase in daily active usage during pilot
- 2x
50% Fewer Manual Validation Cycles
The system achieved a 50% reduction in manual validation cycles, improving throughput and accelerating delivery timelines.
- Reduction in manual validation cycles
- 50%
- Faster internal testing workflows
- 30%
60% Cloud Cost Reduction
The platform achieved a 60% reduction in monthly cloud costs while maintaining uptime and transaction stability during and after optimization.
- Saved per month
- $4,800
- Annual savings
- $57,000+
Our Observability Assessment Covers Three Core Areas
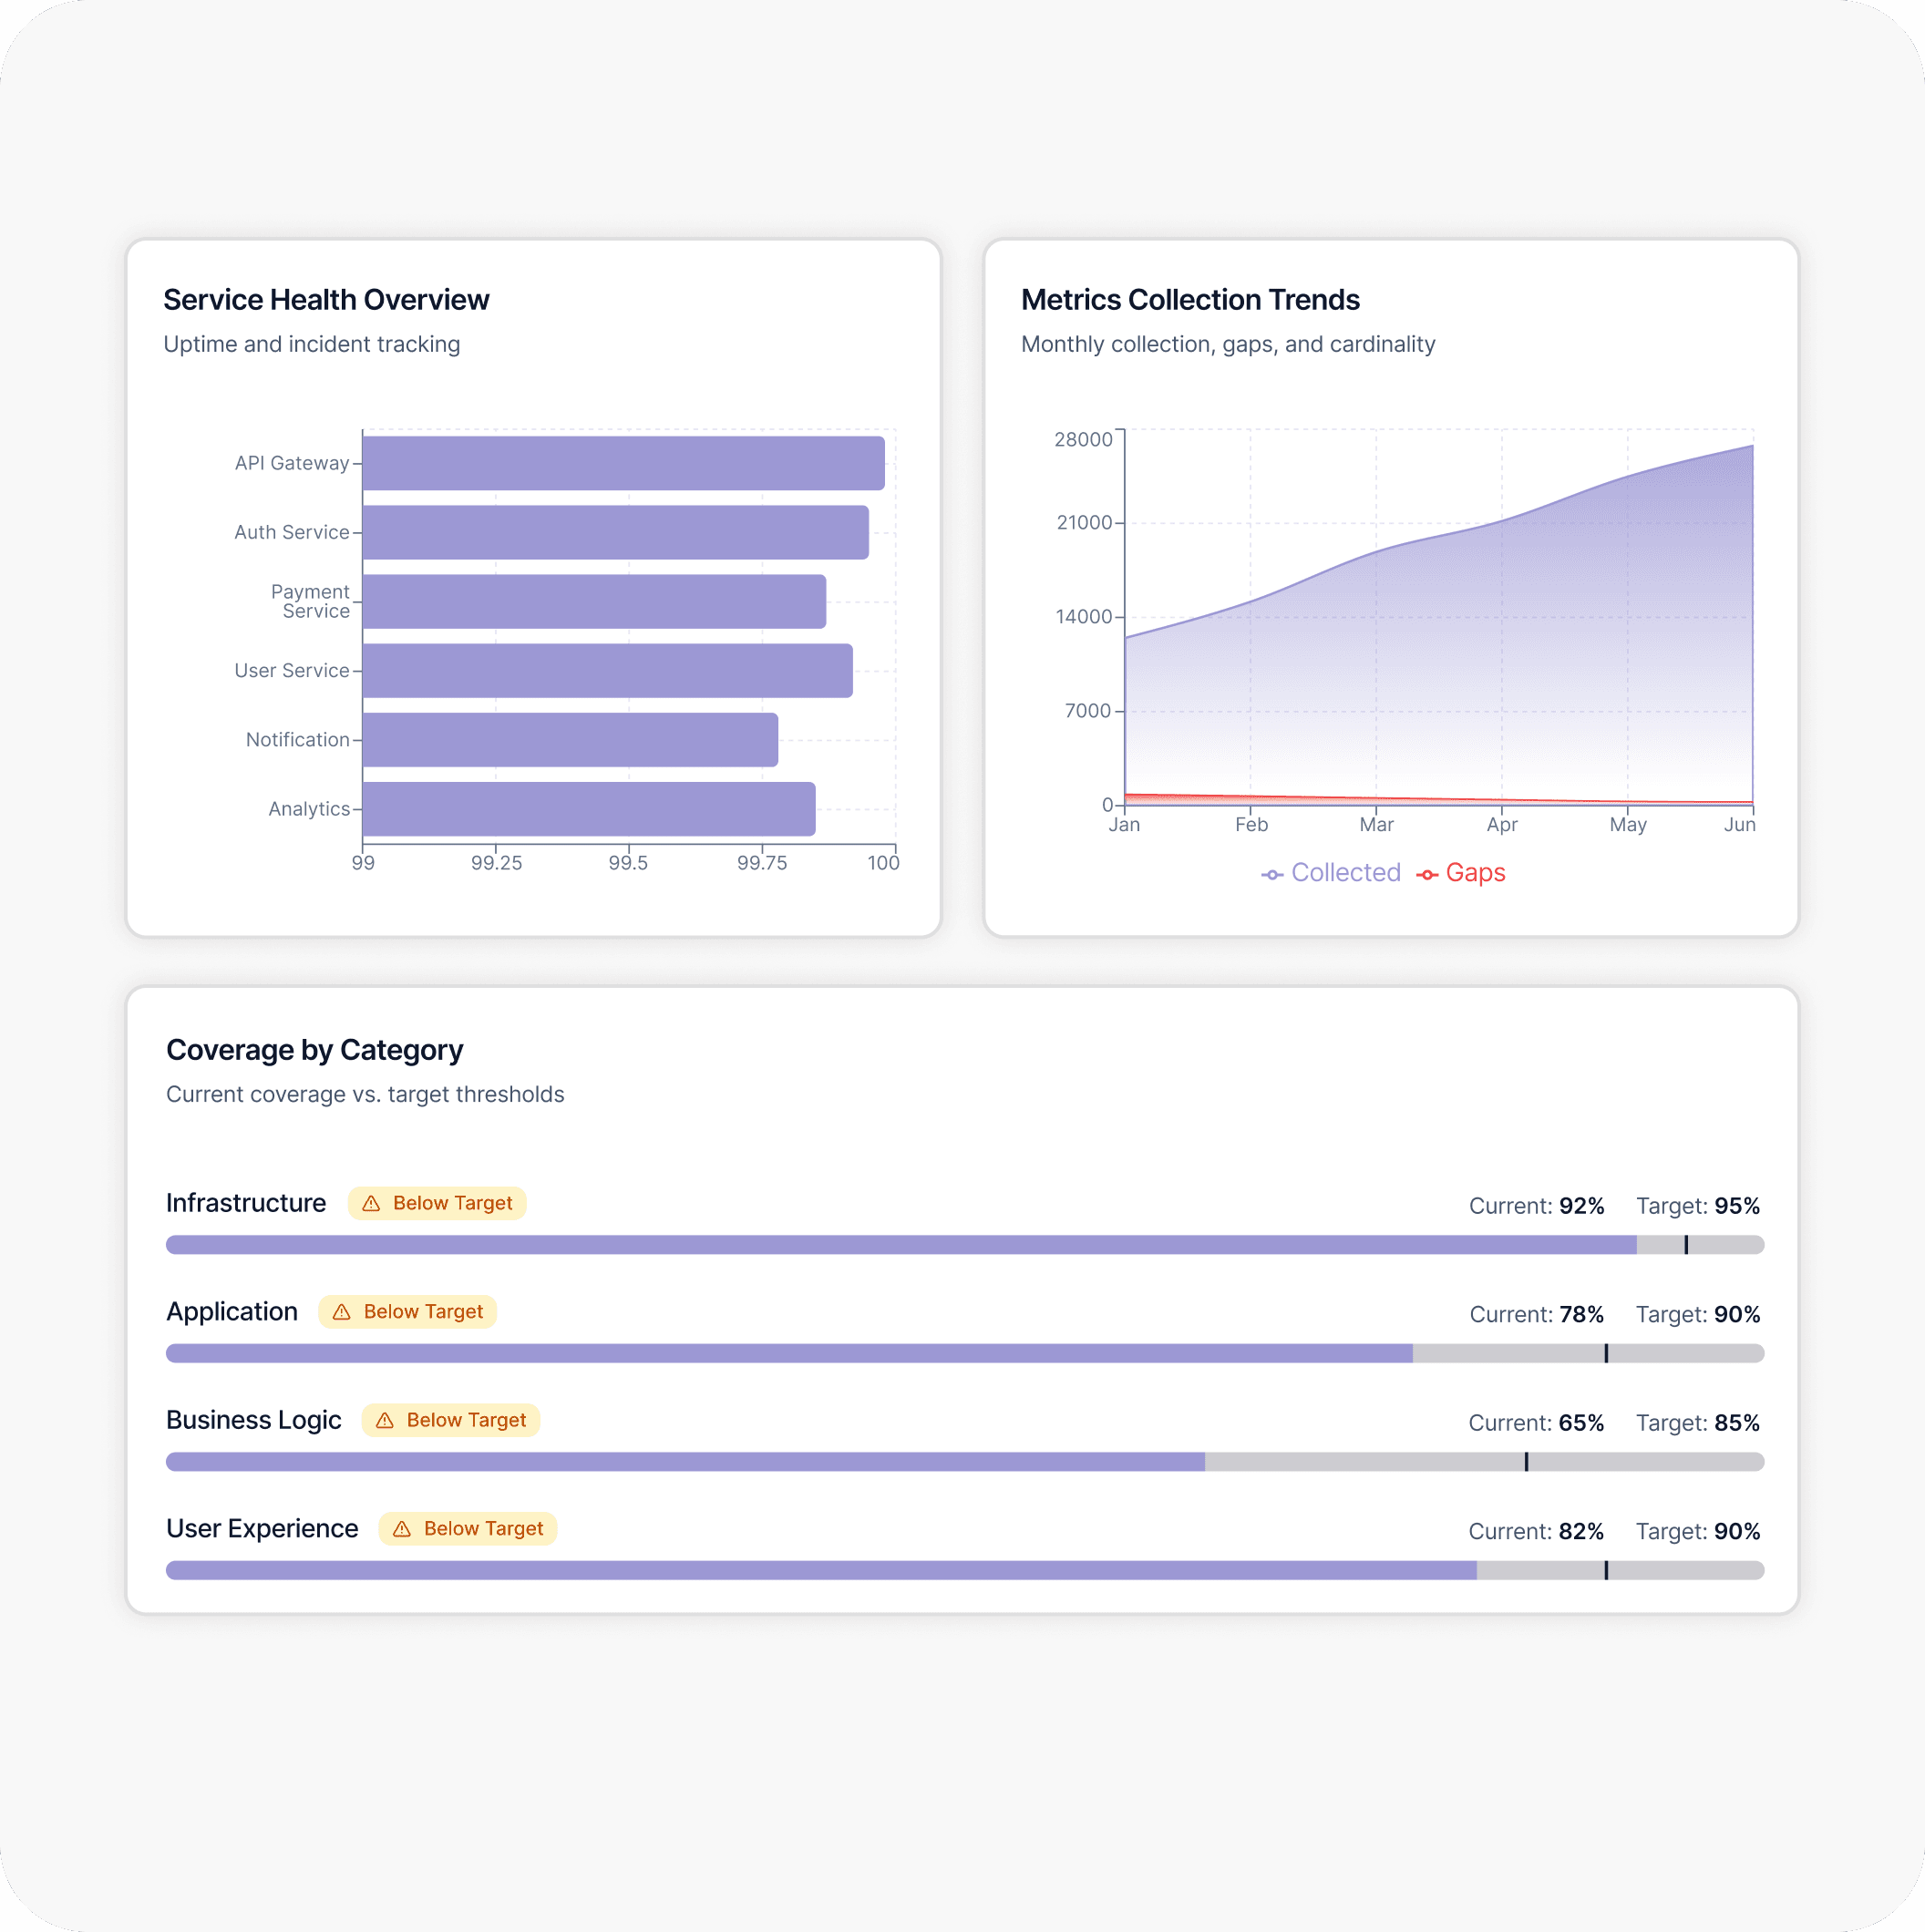
Our engineers run a deep-system review across three pillars: instrumentation coverage, pipeline efficiency, and threshold maturity. We go through your configs, log aggregation logic, and dashboard queries with your team to pin down visibility gaps, redundant telemetry, and operational risk.
- Metrics stack assessment: Collection gaps, cardinality issues, dashboard effectiveness, and retention policies
- Service-level visibility: Coverage across infrastructure, application, and business-layer metrics
- Synthetic and real-user monitoring: Uptime checks, transaction tracing, and user-journey observability
- Alerting threshold review: Whether your thresholds are tuned to your actual traffic patterns
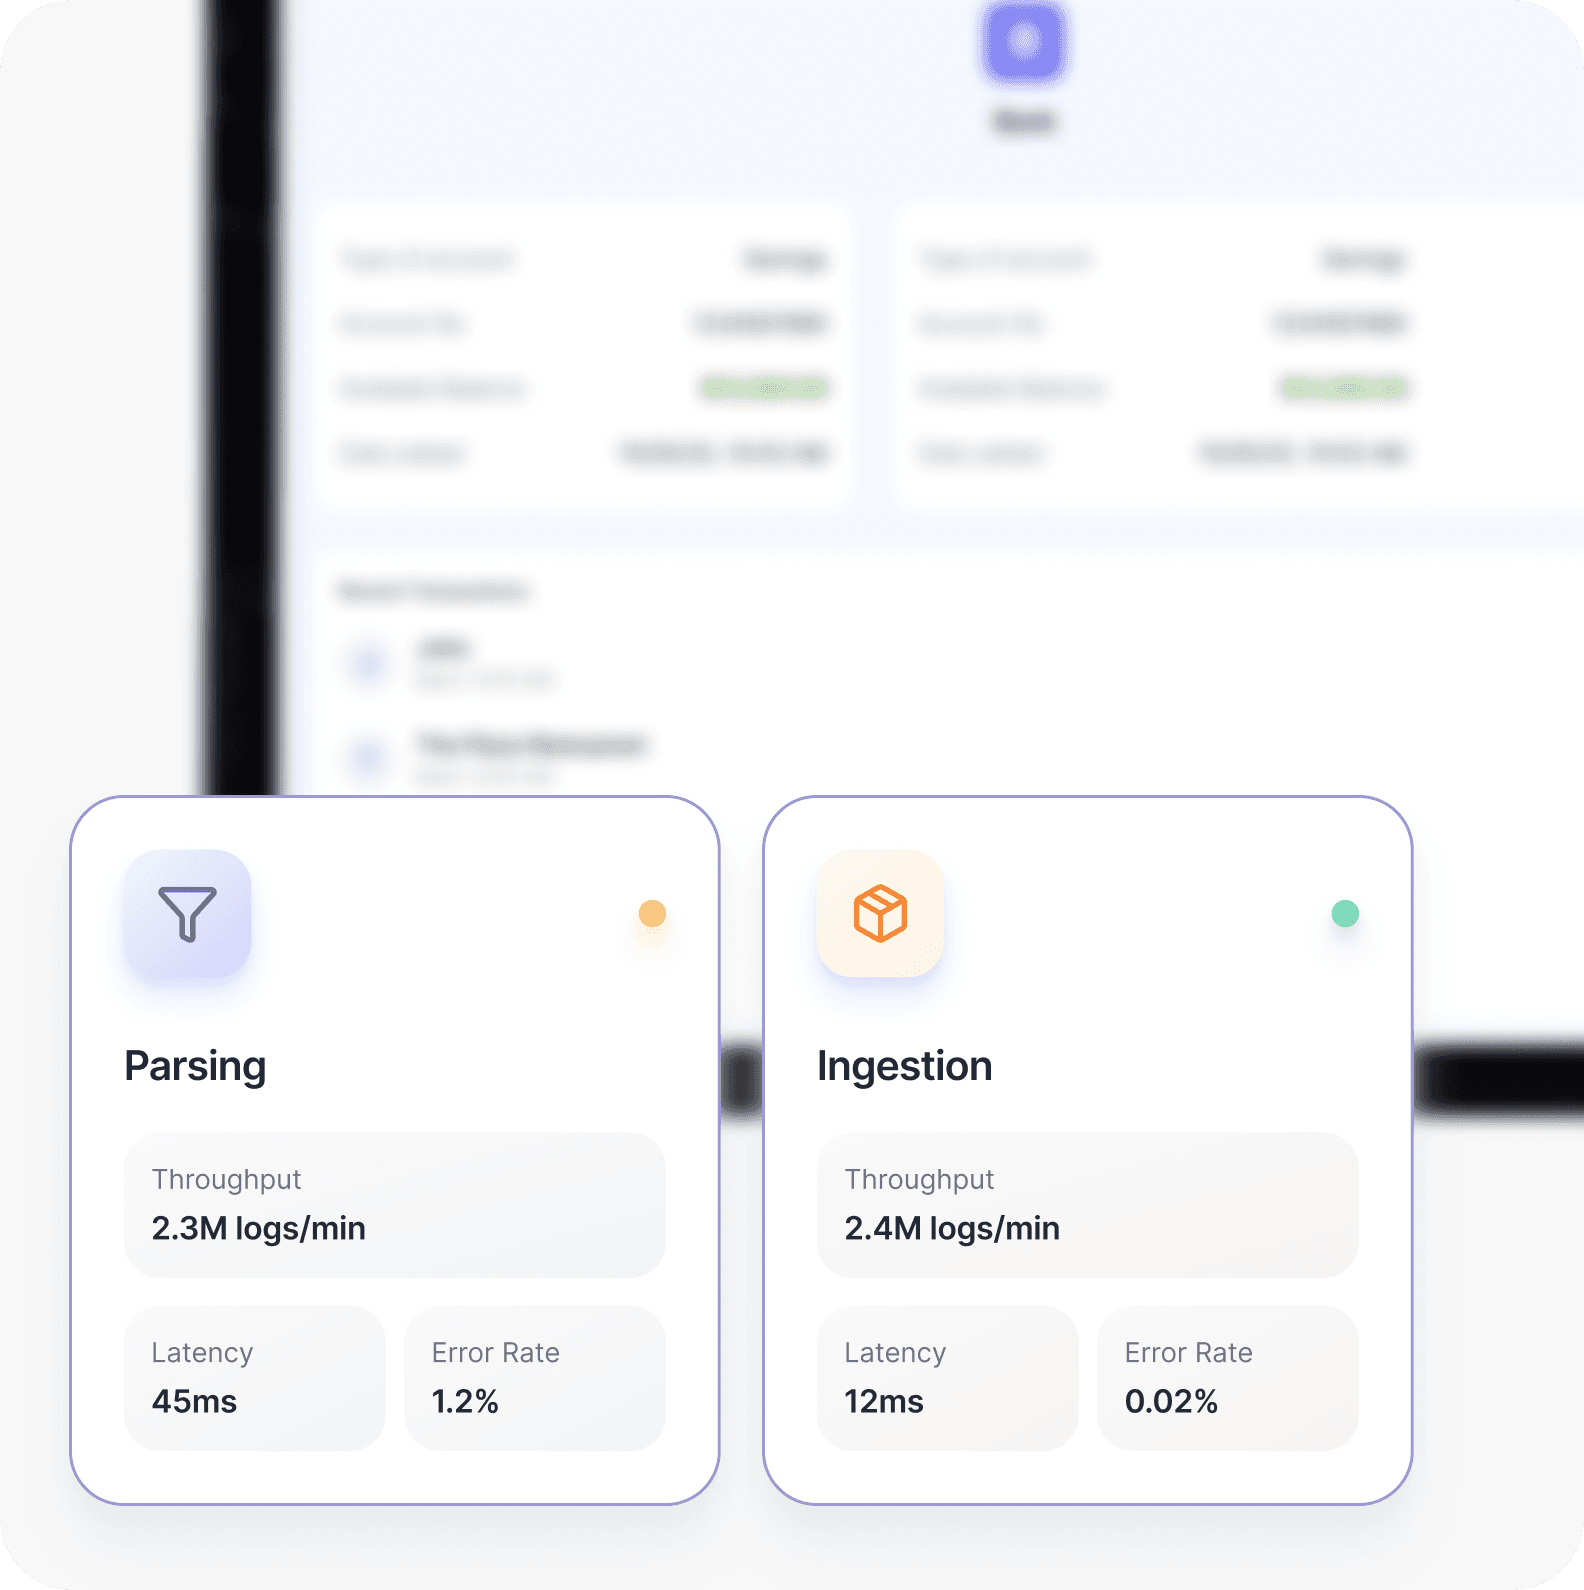
- End-to-end log pipeline audit: Ingestion, parsing, enrichment, and storage workflow mapping
- Structured logging adoption: Consistency of log formats across services and environments
- Log retention and compliance: Coverage against audit requirements, cost, and query efficiency
- Noise and verbosity review: Logs generating cost without contributing to diagnostic value
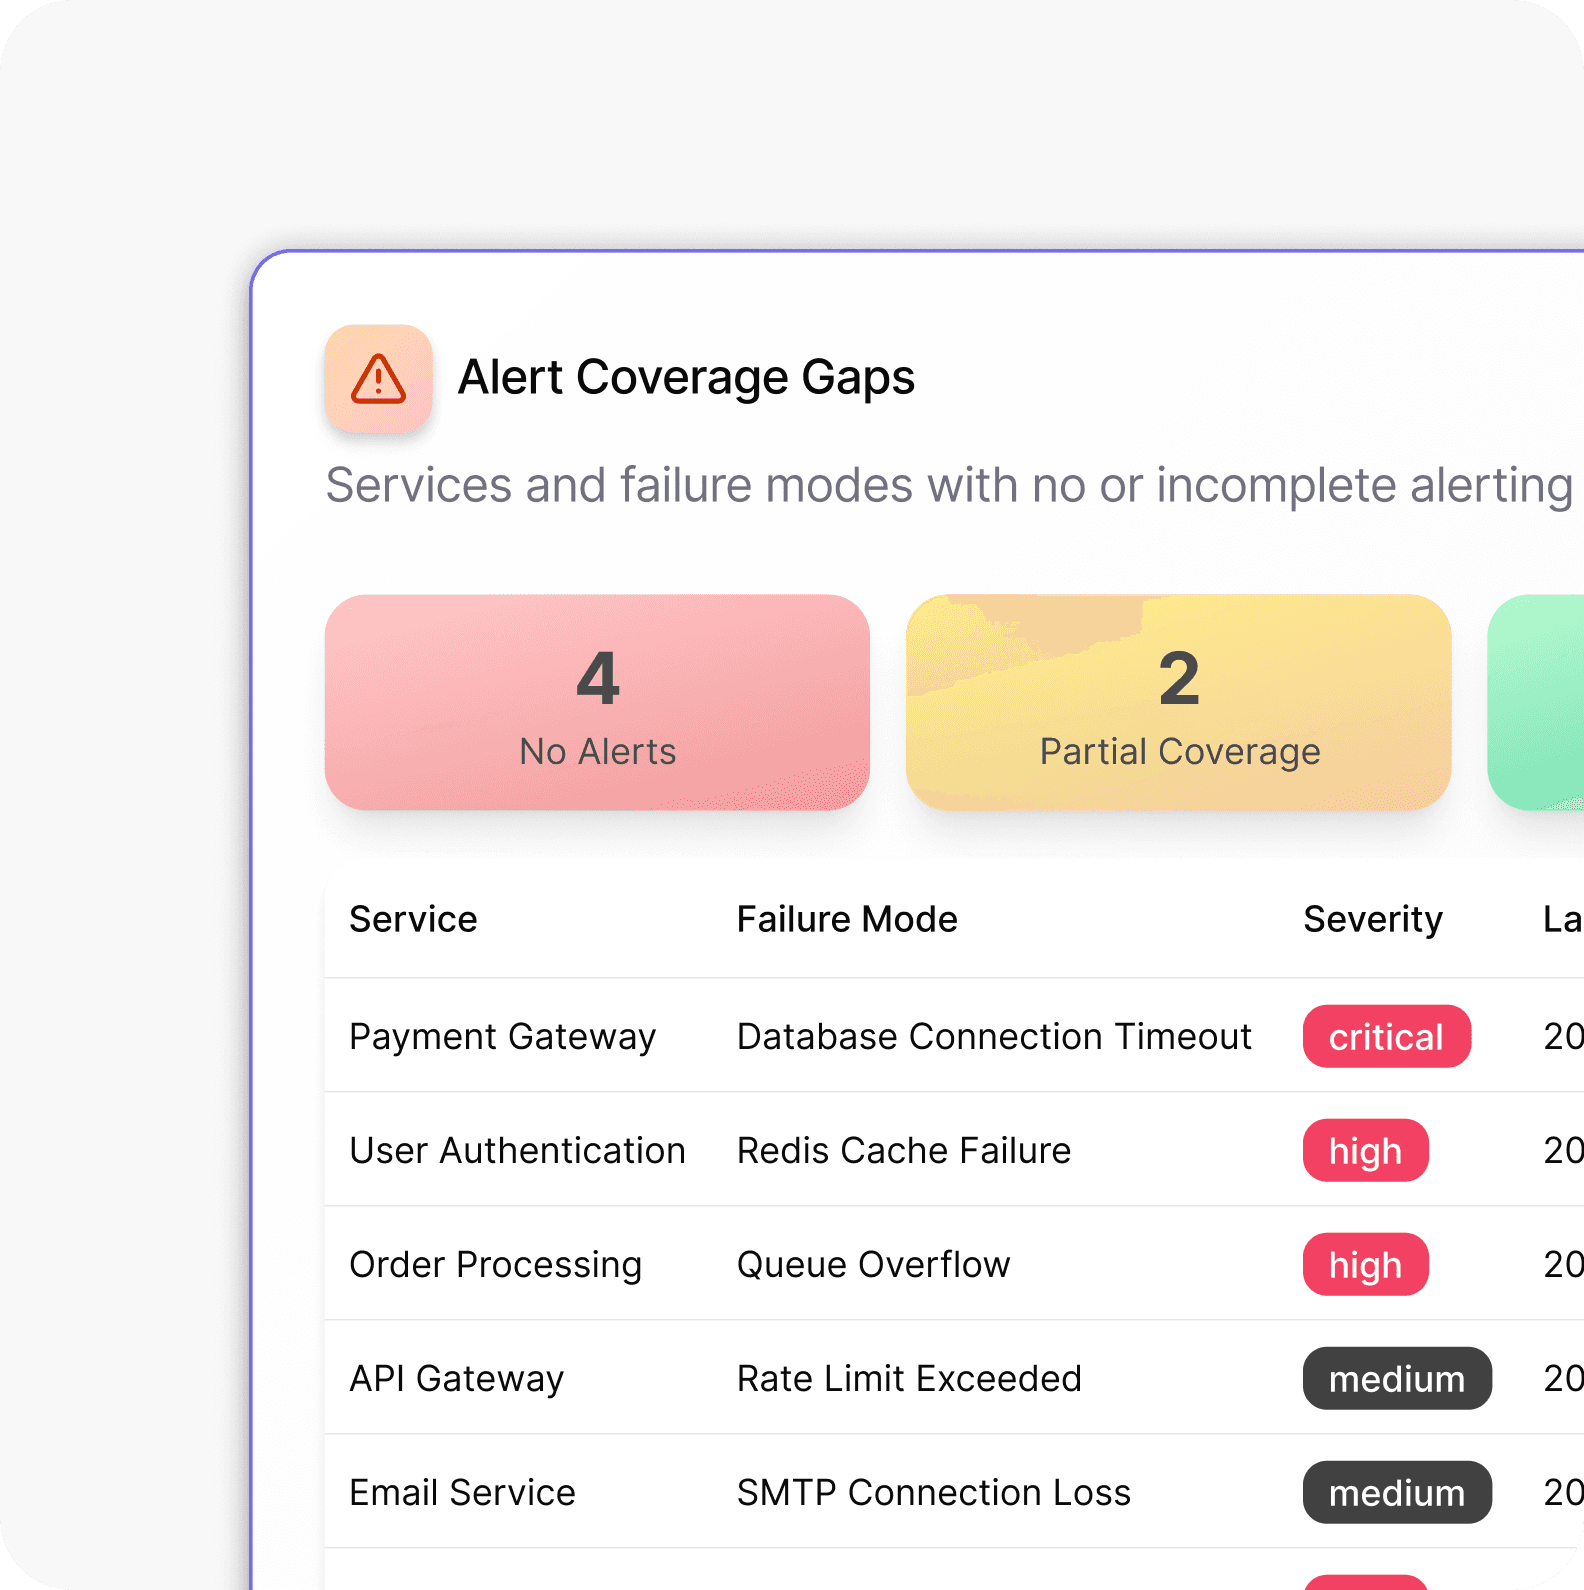
- Alert coverage gaps: Services and failure modes with no alerting in place
- Alert fatigue analysis: False positive rates, suppressed alerts, and on-call burnout indicators
- Escalation path review: Routing logic, on-call rotation structure, and runbook availability
- Incident correlation capability: Whether your tooling supports fast root cause identification across services
What the Data Shows About Observability Gaps Today
These patterns show up across industry research and in the engagements we run. Here's what the latest data says.
40%
of engineering time spent on reactive incident response instead of product work
60–80%
of alerts require no human action at all
50%
of teams still haven't adopted OpenTelemetry for tracing
87%
of ingested telemetry is never queried
Improvements an Observability Assessment Can Prioritize
Our assessment maps gaps across monitoring, logging, tracing, alerting, and incident workflows, and reviews what your observability tooling is costing you. The findings go into a prioritized roadmap, so your team can see which visibility and operational issues need immediate action and which can be handled incrementally.
Clear Ownership When Things Break
Know exactly which service failed, why it failed, and who responds — so incident recovery follows a process, not instinct.
Improve Release Visibility
Strengthen monitoring, tracing, and post-deployment checks so your team can see how each release behaves in production and investigate unexpected changes faster.
Make Every Environment Fully Visible
Bring logging, metrics, and tracing into alignment across dev, staging, and production so no environment is a black box.
Stop Paying for Observability That Doesn't Observe
Get a line-by-line view of your tooling spend so every dollar is tied to meaningful signal — not noise, duplication, or unused retention.
Industries We Service
We build observability strategies around the operational realities of each industry. That means accounting for compliance demands, incident sensitivity, and the technical details specific to each sector. Our team stays involved end to end, from assessment through implementation, across every industry we list.
DevOps Assessments by Engineering Teams that Have Built 1000+ Global Projects
Our experience from working on complex engineering projects has taught us that no two infrastructures are alike. However, the problems almost always are: misconfigured pipelines, invisible cost drains, environments that drift apart, and incident processes held together by institutional memory rather than documentation. Our assessors bring pattern recognition that only comes from having seen it all. So your assessment isn't a generic checklist; it's a diagnosis built on real engineering experience.
Our AI-enabled engineers and assessors have led observability transformations at scale.
Every gap is tied to MTTR, reliability impact, or hidden cost. Engineering solutions are always mapped to business outcomes.
We recommend what's right for your context — not what we sell. If a tool you already have can do the job, we'll tell you.
The roadmap you receive is specific enough to hand directly to an engineer and start executing the same week.
We document every finding so your team fully owns the outcome — with complete clarity and no dependency on us after delivery.
Our Offerings in DevOps Consulting and Services
Our Latest Thinking
FAQs About DevOps Assessment and Observability (Monitoring, Logging & Alerts) Services
An Observability Assessment is a structured audit of your monitoring stack, logging pipelines, and alerting systems. It uncovers visibility gaps, noisy or missing alerts, and tooling inefficiencies — and delivers a prioritized roadmap your team can act on immediately.
Most engagements run between 2 and 4 weeks, depending on the number of services, the complexity of your logging and tracing setup, and how many environments require review. The timeline of the project can be more considering the complexity of the project.
We work within whatever boundaries your security policy allows. Read-only access to your monitoring dashboards, log pipelines, and alerting configs is typically sufficient to conduct a thorough assessment.
Minimal disruption. We typically need 2 to 3 working sessions with key engineers and access to your existing documentation. Most teams report spending fewer than 4 hours total across the entire engagement.
Especially for smaller teams. The less headcount you have, the more damage a single undetected incident or a misfiring alert can cause. An observability assessment helps you respond faster and build the right foundations before scale forces your hand.
You receive a written findings report, a prioritized improvement roadmap broken into 30, 60, and 90-day actions, an observability tooling cost audit, and a live readout session with your team to walk through everything in detail.
A consultant typically comes in to build or operate. An observability assessment is diagnostic first — we tell you what's broken, what's missing, and in what order to fix it, so you can make informed decisions about whether to act internally or bring in outside help.
We are vendor-neutral and work across Datadog, Grafana, Prometheus, New Relic, CloudWatch, and a wide range of logging platforms including the ELK Stack, Loki, and Splunk. Our recommendations are always based on what fits your context, not what we prefer.
That's entirely your call. Some clients take the findings and execute internally. Others engage us to help close specific gaps. Either way, the assessment stands alone as a complete, actionable deliverable.
A cloud observability assessment covers metrics coverage, logging pipelines, distributed tracing, dashboards, alert thresholds, escalation workflows, telemetry retention, and tooling costs across both infrastructure and applications. GeekyAnts also checks whether your team can correlate signals across services and environments, since that is where many detection and diagnosis problems start.