
What is OpenTelemetry?
“OpenTelemetry is an open-source project under the Cloud Native Computing Foundation (CNCF) that aims to standardize the collection and export of telemetry data, including traces, metrics, and logs, from distributed systems and microservices architectures. Originally formed by the merger of the OpenTracing and OpenCensus projects, OpenTelemetry provides a unified framework for instrumenting applications, libraries, and infrastructure components to gather telemetry data and send it to backend systems for analysis and visualization.”
OpenTelemetry is an open-source project that helps developers monitor and understand their software's performance and behavior. It provides a set of tools, APIs, and SDKs (Software Development Kits) that make it easier to collect, process, and export telemetry data such as traces, metrics, and logs from your applications.
Benefits of OpenTelemetry
OpenTelemetry offers several advantages for organisations looking to streamline their observability efforts:
- Vendor Neutrality: No more being locked into a single vendor! OTel lets you collect data from various sources and send it to different platforms, offering flexibility in your monitoring setup.
- Data Flexibility: You control what data gets sent. OTel allows you to filter and customize the telemetry you collect, ensuring you capture only the information you need for optimal performance analysis.
- Extensibility: OpenTelemetry supports a wide range of programming languages and frameworks, making it easy to integrate with your existing applications and infrastructure.
How Does OpenTelemetry Work?
OpenTelemetry works by providing a unified and standardised approach to collect and process telemetry data from your applications. It begins with instrumentation, where developers either manually add code using OpenTelemetry APIs or utilize auto-instrumentation libraries to automatically gather data such as traces, metrics, and logs. This data captures crucial information about the application's performance and behavior. OpenTelemetry ensures context propagation, maintaining the continuity of request data across various components and services in a distributed system.
The collected data is then processed and exported using processors and exporters, which send it to chosen observability platforms like Prometheus or Jaeger.
Once the data reaches these backends, it can be analyzed and visualized through dashboards and alerts, helping developers monitor system health, diagnose issues, and optimize performance. By standardizing telemetry collection and processing, OpenTelemetry simplifies observability and enhances the ability to maintain and improve complex software systems.
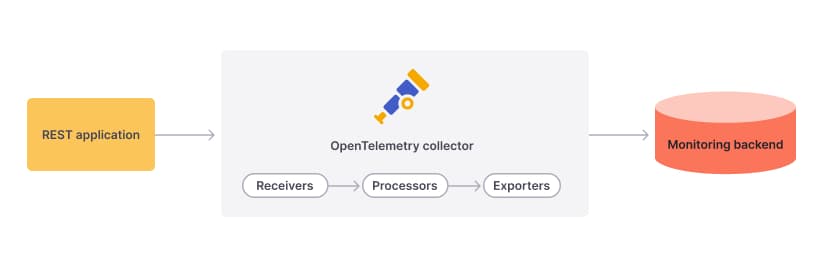
In short, OpenTelemetry empowers you with a standardised and efficient way to monitor your applications, leading to a clearer understanding of your system's overall health and performance
Let us see a example of OpenTelemetry with Jaeger and Prometheus along with NestJS.
While OpenTelemetry provides a standardized way to collect data, specific tools excel in analyzing different aspects of your system's health. Here is a quick introduction to two popular options:
- Jaeger: This open-source tool focuses on distributed tracing. It maps the journey of a user request across various microservices in your system. This helps pinpoint performance bottlenecks and identify where requests might be slowing down.
- Prometheus: This tool acts as a metrics monitoring and alerting system. It collects and analyzes time-series data, such as CPU usage, memory consumption, or request latency. Prometheus helps you identify trends and potential issues by providing real-time insights into your system's resource utilization.
Setting Up OpenTelemetry in a NestJS Project with Docker (Step-by-Step Instructions)
Step 1: Create a New NestJS Project
First, create a new NestJS project using the Nest CLI:
nest new my-opentelemetry-demoNavigate into your newly created project directory:
cd my-nestjs-projectStep 2: Update app.controller.ts
Modify the app.controller.ts file to add a new endpoint. This is what your file should look like:
import { Controller, Get } from '@nestjs/common';
import { AppService } from './app.service';

@Controller()
export class AppController {
  constructor(private readonly appService: AppService) {}

  @Get('test')
  getHello(): string {
    return this.appService.getHello();
  }
}
Step 3: Create the Configuration Files
Navigate to the src directory and create a config folder:
cd src
mkdir config
Inside the config folder, create the following files:
opentelemetry.ts
cd config
touch opentelemetry.ts
Add the following content to opentelemetry.ts:
import { NodeSDK } from '@opentelemetry/sdk-node';
import * as process from 'process';
import { getNodeAutoInstrumentations } from '@opentelemetry/auto-instrumentations-node';
import { AsyncHooksContextManager } from '@opentelemetry/context-async-hooks';
import * as api from '@opentelemetry/api';

const contextManager = new AsyncHooksContextManager().enable();
api.context.setGlobalContextManager(contextManager);

export const otelSDK = new NodeSDK({
  instrumentations: [
    getNodeAutoInstrumentations(),
  ],
});

process.on('SIGTERM', () => {
  otelSDK
    .shutdown()
    .then(
      () => console.log('Shut down successfully'),
      (err) => console.log('Error shutting down ', err),
    )
    .finally(() => process.exit(0));
});
Create otel-collector-config.yaml:
touch otel-collector-config.yamlAdd the following content to otel-collector-config.yaml:
receivers:
  otlp:
    protocols:
      grpc:

exporters:
  prometheus:
    endpoint: '0.0.0.0:8889'
    const_labels:
      label1: value1

  debug:

  otlp:
    endpoint: jaeger:4317
    tls:
      insecure: true

processors:
  batch:

extensions:
  health_check:
  pprof:
    endpoint: :1888
  zpages:
    endpoint: :55679

service:
  extensions: [pprof, zpages, health_check]
  pipelines:
    traces:
      receivers: [otlp]
      processors: [batch]
      exporters: [debug, otlp]
    metrics:
      receivers: [otlp]
      processors: [batch]
      exporters: [debug, prometheus]
Create prometheus.yaml:
touch prometheus.ymlAdd the following content to prometheus.yml:
scrape_configs:
  - job_name: tyfoneService
    scrape_interval: 5s
    static_configs:
      - targets: [host.docker.internal:8888]
Step 4: Create Docker Configuration Files
In the root directory of your project, create the Docker configuration files.
‘Dockerfile'
touch DockerfileAdd the following content to Dockerfile:
FROM node:18

WORKDIR /app

COPY package*.json ./

RUN npm install

COPY . .

RUN npm run build

CMD ["node", "dist/main.js"]
Create docker-compose.yml:
touch docker-compose.ymlAdd the following content to docker-compose.yml:
version: '3.5'

services:

  jaeger:
    image: jaegertracing/all-in-one:latest
    ports:
      - '16686:16686'
      - '14268'
      - '14250'
    networks:
      - demo-network

  prometheus:
    image: prom/prometheus:latest
    ports:
      - '9090:9090'
    volumes:
      - ./src/config/prometheus.yml:/etc/prometheus/prometheus.yml

  otel-collector:
    image: otel/opentelemetry-collector:latest
    restart: always
    command: ['--config=/etc/otel/config.yaml', '']
    ports:
      - '1888:1888'
      - '8888:8888'
      - '8889:8889'
      - '13133:13133'
      - '4317:4317'
      - '55679:55679'
    volumes:
      - ./src/config/otel-collector-config.yaml:/etc/otel/config.yaml
    depends_on:
      - jaeger
    networks:
      - demo-network

  app:
    build:
      context: .
      dockerfile: Dockerfile
    container_name: nest-app
    env_file:
      - .env
    environment:
      - NODE_ENV=${NODE_ENV}
      - PORT=${PORT}
    ports:
      - '3000:3000'
    depends_on:
      - otel-collector
    volumes:
      - ./src:/app/src
    networks:
      - demo-network

networks:
  demo-network:
Step 5: Create the .env File
In the root directory, create a .env file:
touch .envAdd the following content to .env:
NODE_ENV=dev
PORT=3000
OTEL_TRACES_EXPORTER="otlp"
OTEL_METRICS_EXPORTER="otlp"
OTEL_EXPORTER_OTLP_ENDPOINT="http://otel-collector:4317"
OTEL_EXPORTER_OTLP_TRACES_PROTOCOL="grpc"
OTEL_NODE_RESOURCE_DETECTORS="env"
OTEL_SERVICE_NAME="demo-service-backend"
NODE_OPTIONS="--require @opentelemetry/auto-instrumentations-node/register"
Final Project Structure
After following the above steps, your project structure should look like this:
project-root/
├── .env
├── Dockerfile
├── docker-compose.yml
├── src/
│   ├── config/
│   │   ├── opentelemetry.ts
│   │   ├── otel-collector-config.yaml
│   │   ├── prometheus.yml
│   ├── app.controller.ts
│   ├── app.service.ts
│   └── ... (other files and folders)
├── package.json
├── package-lock.json
└── ... (other files and folders)
Step 6: Run the Services with Docker Compose
To start all the services defined in your docker-compose.yml file, use the following command:
docker-compose up
Ports and Services
Backend Application: Running on http://localhost:3000
Jaeger UI: Running on http://localhost:16686
Prometheus: Running on http://localhost:9090
Now that your services are up and running, it is time to see them in action.
Step 1: Hit the Test Endpoint
Open your browser and navigate to http://localhost:3000/test. Refresh the page a few times to generate some traffic.
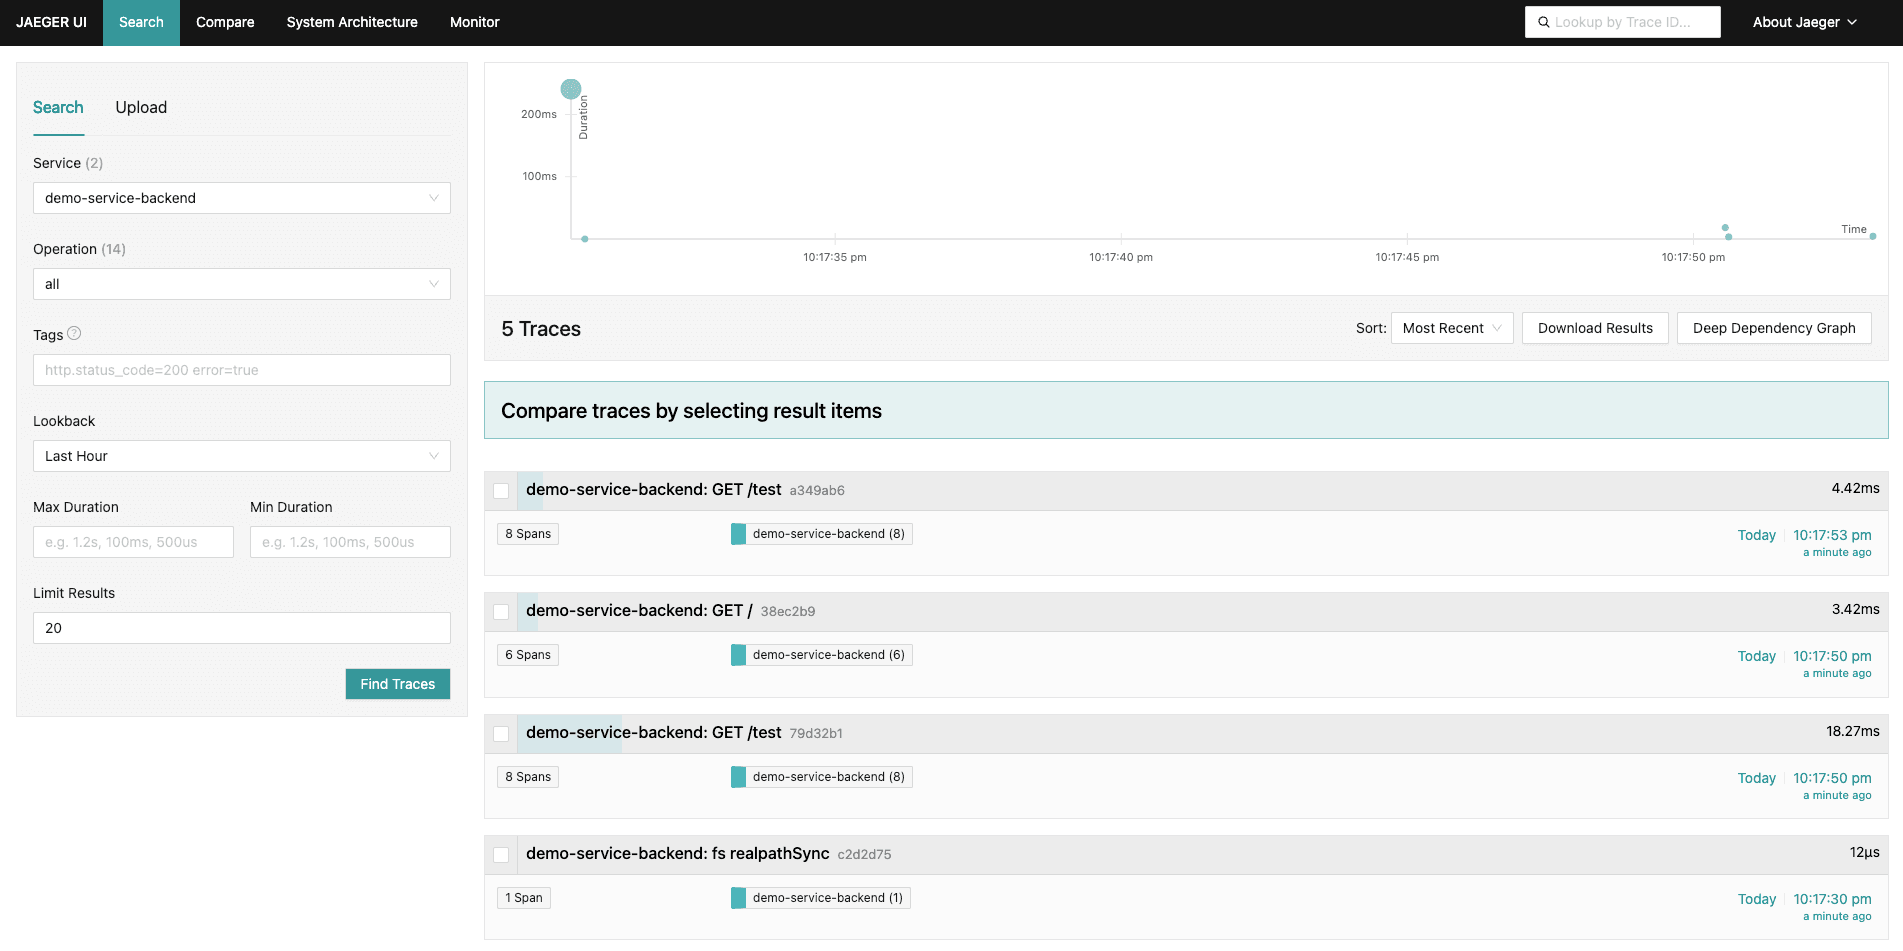
Step 2: Explore Jaeger UI
Jaeger is a tool for monitoring and troubleshooting microservices-based distributed systems. It will help you visualize the traces collected by OpenTelemetry.
- Jaeger UI: Open your browser and go to http://localhost:16686.
- In the Jaeger UI, you can search for traces of your requests. Use the
demo-service-backendas the service name to filter the traces. - You will see a detailed view of each trace, showing how your request flowed through the application.
Step 3: Explore Prometheus
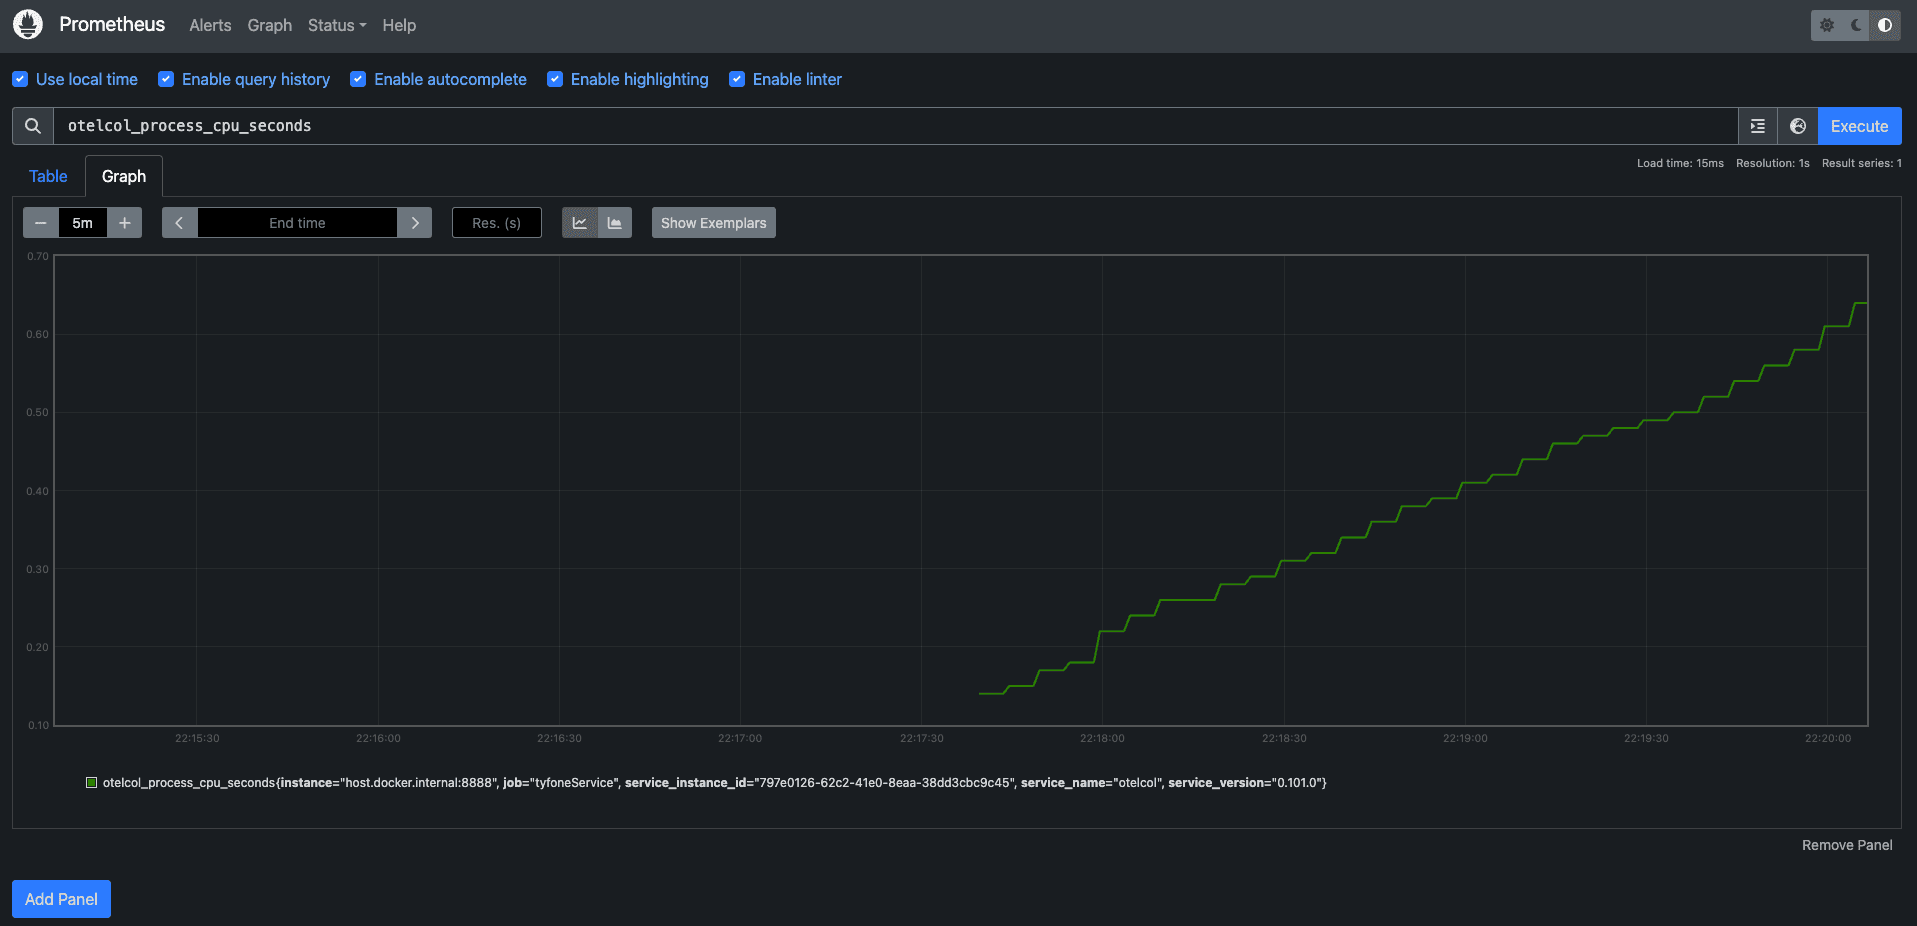
Prometheus is an open-source system monitoring and alerting toolkit. It collects metrics, stores them, and allows you to query them.
- Prometheus: Open your browser and go to http://localhost:9090.
- In the Prometheus UI, you can explore the metrics being collected. Use the Graph tab to visualize these metrics over time.
- You can query metrics such as
otelcol_process_cpu_seconds, which shows the number of spans sent by the OpenTelemetry collector.

Conclusion
By hitting the test endpoint and exploring the Jaeger and Prometheus UIs, you can see the powerful observability tools in action. Jaeger helps you trace the path of requests through your microservices, while Prometheus provides insights into your system's metrics. This setup ensures you have the visibility needed to monitor and troubleshoot your application effectively.