Remote debugging in Heroku

Aug 8, 2024

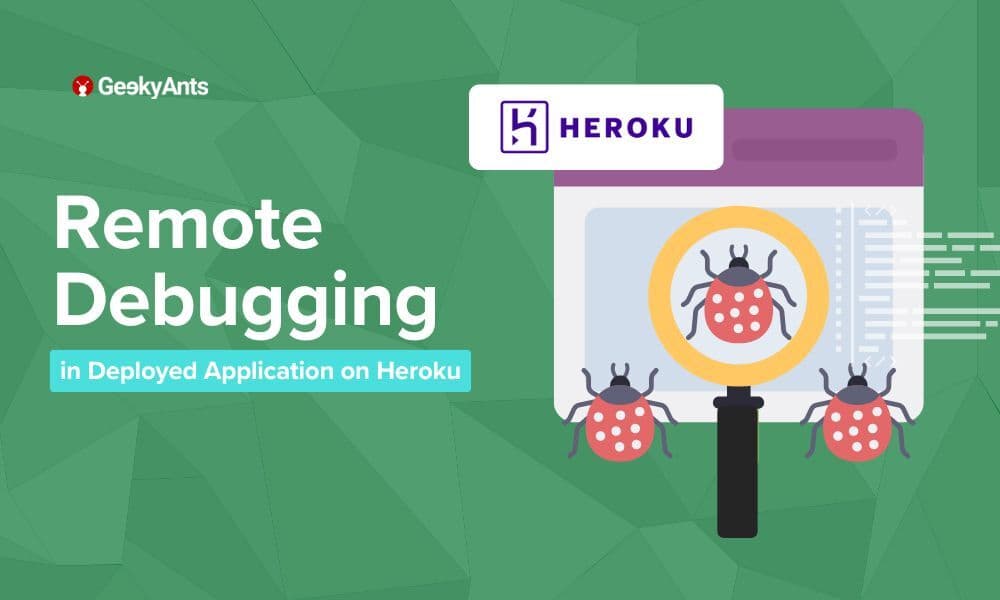
Remote debugging in Heroku

Discover how to easily set up remote debugging for your Node.js app on Heroku, and diagnose issues like a pro with our step-by-step guide!

Author

Shivam Pundir
Shivam PundirSenior Software Engineer - II

Hey there, fellow coder! Have you ever wished you could just step through your Node.js app running on Heroku like a local app? Well, grab your favorite drink and get comfy because we’re about to embark on a fun journey to set up remote debugging on Heroku!

Why Remote Debugging?

Debugging is a crucial part of development, ensuring your app runs smoothly and efficiently. Remote debugging is especially important when your app is deployed on a server, allowing you to diagnose issues that only appear in a deployed environment.

Prerequisites

Before we jump in, make sure you have:

  • A Node.js application deployed on Heroku.
  • The Heroku CLI installed on your machine.

Debugging Steps

Step 1: Enable Remote Debugging

First, we need to enable remote debugging for your Node.js app. Heroku uses the inspect flag to allow remote debugging.

  1. Modify Your Procfile: Add the --inspect flag to your Procfile. It should look something like this:
web: node –inspect index.js

2. Deploy Changes to Heroku: Commit your changes and push to Heroku:

git add Procfile
git commit -m “Enable remote debugging”
git push heroku master

Step 2: Open a Remote Debugging Session

Now that your app is configured, it’s time to connect to the remote debugger.

  1. Restart Your Heroku App: Restarting ensures the inspect flag is applied:
heroku restart

2. Forward Debugging Port: Forward traffic on a local port to a port inside a dyno; in this case both the local port and dyno port are 9229:

heroku ps:forward 9229

Step 3: Connect Your Debugger

With the SSH tunnel set up, you can now connect your favourite debugger. 

Using VS Code

  1. Open VS Code: Launch VS Code and open your project.
  2. Configure Debugger: Add a new configuration in your launch.json:
{
   "version": "0.2.0",
   "configurations": [{
       "address": "localhost",
       "localRoot": "${workspaceFolder}",
       "name": "Attach to Remote",
       "port": 9090,
       "remoteRoot": "/app",
       "request": "attach",
       "skipFiles": ["<node_internals>/**"],
       "type": "node",
   }]
}

3. Start Debugging: Select the "Attach to Heroku" configuration and start debugging. Set breakpoints, inspect variables, and step through your code like in a local environment.

Using IntelliJ IDEA / Webstorm

  1. Open Run Config: Open your IDE and go to Run > Edit Configurations. 
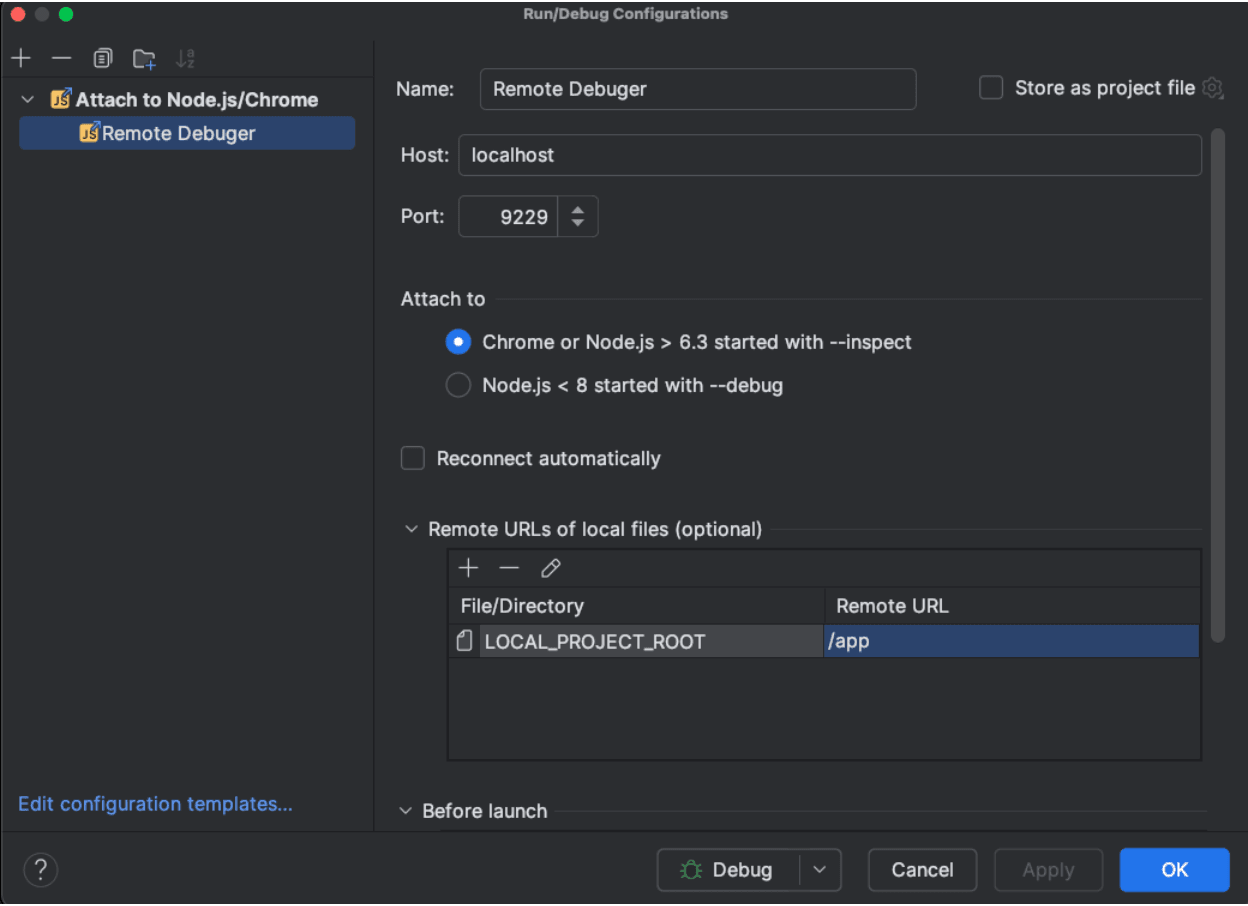
  2. Configure Debugger: Click the + button and select Attach to Node.js/Chrome:

3. Start Debugging: Select your newly created Node.js Remote Debug configuration, Click the debug icon and start debugging. Set breakpoints, inspect variables, and step through your code like in a local environment.

And there you have it! You’ve just set up remote debugging for your Node.js app on Heroku. High five!  Debugging in the cloud just became a whole lot cooler, right? If you hit any bumps along the way, double-check your SSH tunnel and configurations. Happy debugging!

Subscribe to Our Newsletter

More from the engineering frontline.

Dive deep into our research and insights on design, development, and the impact of various trends to businesses.
Insight
Why Legacy Systems Make Business Growth More Expensive: Navigate A Smarter Path to Legacy Modernization
Sep 23, 2026

Why Legacy Systems Make Business Growth More Expensive: Navigate A Smarter Path to Legacy Modernization

Learn how legacy systems make business growth more expensive and how edge-first modernization can remove constraints without replacing the existing system.

Insight
SSO, Audit Logs and RBAC: The Enterprise Features AI Prototyping Tools Do Not Cover | Sarika Gautam
Sep 23, 2026

SSO, Audit Logs and RBAC: The Enterprise Features AI Prototyping Tools Do Not Cover | Sarika Gautam

Why AI-generated prototypes fail enterprise review: the context behind SSO, the cost of skipping audit logs, and how role explosion makes RBAC a product of its own.

Insight
Feature Flags as Technical Debt: The Cleanup Nobody Schedules
Sep 21, 2026

Feature Flags as Technical Debt: The Cleanup Nobody Schedules

This blog explains how unmanaged feature flags create technical debt and how teams can detect, manage, and remove them safely.

Insight
Building AI-First Enterprises: Why System Design Matters More Than AI Adoption
Sep 21, 2026

Building AI-First Enterprises: Why System Design Matters More Than AI Adoption

This blog explores how system design, architecture, and validation shape AI-first enterprises, while examining AI’s impact on software engineering and human decision-making.

Insight
The Product Studio in the AI Era: What Actually Changes | Sarika Gautam
Sep 21, 2026

The Product Studio in the AI Era: What Actually Changes | Sarika Gautam

What changes in product development when AI writes the code: the shift to architecture, the token cost of unplanned builds, and why juniors still matter.

Insight
AI and the Future of Digital Customer Experience: Where Technology Meets Human Creativity
Sep 18, 2026

AI and the Future of Digital Customer Experience: Where Technology Meets Human Creativity

A discussion on how AI, human creativity, research, and cross-functional collaboration are shaping the future of digital customer experience.

Insight
Scaling Down Before Scaling Up: Why Bigger Servers Don’t Fix Bad Architecture
Sep 17, 2026

Scaling Down Before Scaling Up: Why Bigger Servers Don’t Fix Bad Architecture

This blog explores how inefficient backend architecture can cause performance issues even under low traffic, covering practical ways to reduce database load, API latency, and resource usage before scaling infrastructure.

The Right Conversation Can

Save You Six Months.

Book a call