Table of Contents
Key Features to Include in Your Custom Data Dashboard App in 2024
Author

Subject Matter Expert

Date

Book a call
In the fast-evolving landscape of business intelligence, staying ahead is not just a choice; it's a necessity. As we approach 2024, the demands on data dashboard apps are higher than ever, and our comprehensive guide unveils the indispensable features that will empower your custom app to not only meet but exceed these expectations.
Join us as we navigate through the intricacies of creating a data dashboard that not only keeps up with the times but sets the standard for intuitive and insightful data analysis. Your roadmap to a cutting-edge data-driven future starts here.
Discover how GeekyAnts builds superlative dashboard applications for clients globally, straight from the heart of innovation.
What is Dashboard Software?
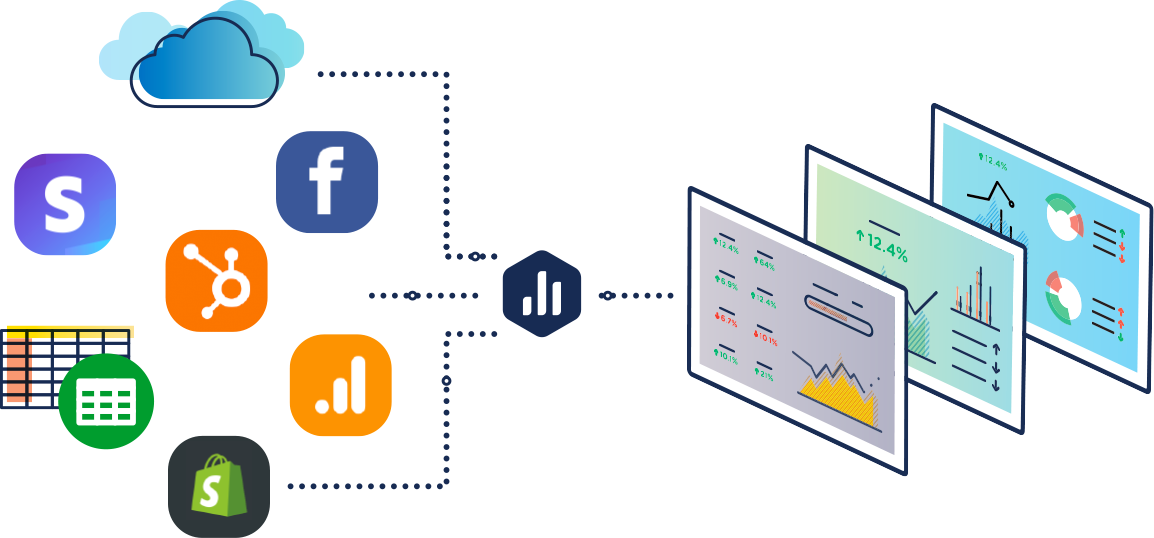
Before we dive into the key features, let's first define what dashboard software is. Dashboard software is a tool or platform that allows businesses to create, customize, and manage data dashboards. These dashboards can be used to monitor and track key metrics, visualize data, and provide insights for decision-making.
The best dashboard software features include ease of use, flexibility, data integration capabilities, and advanced visualization options. These features ensure that the dashboard software is user-friendly, can work with different data sources, and provides visually appealing representations of data.
Now that we have a clear understanding of what dashboard software is let's explore why companies use data dashboards in the first place.
Interactive Data Visualization
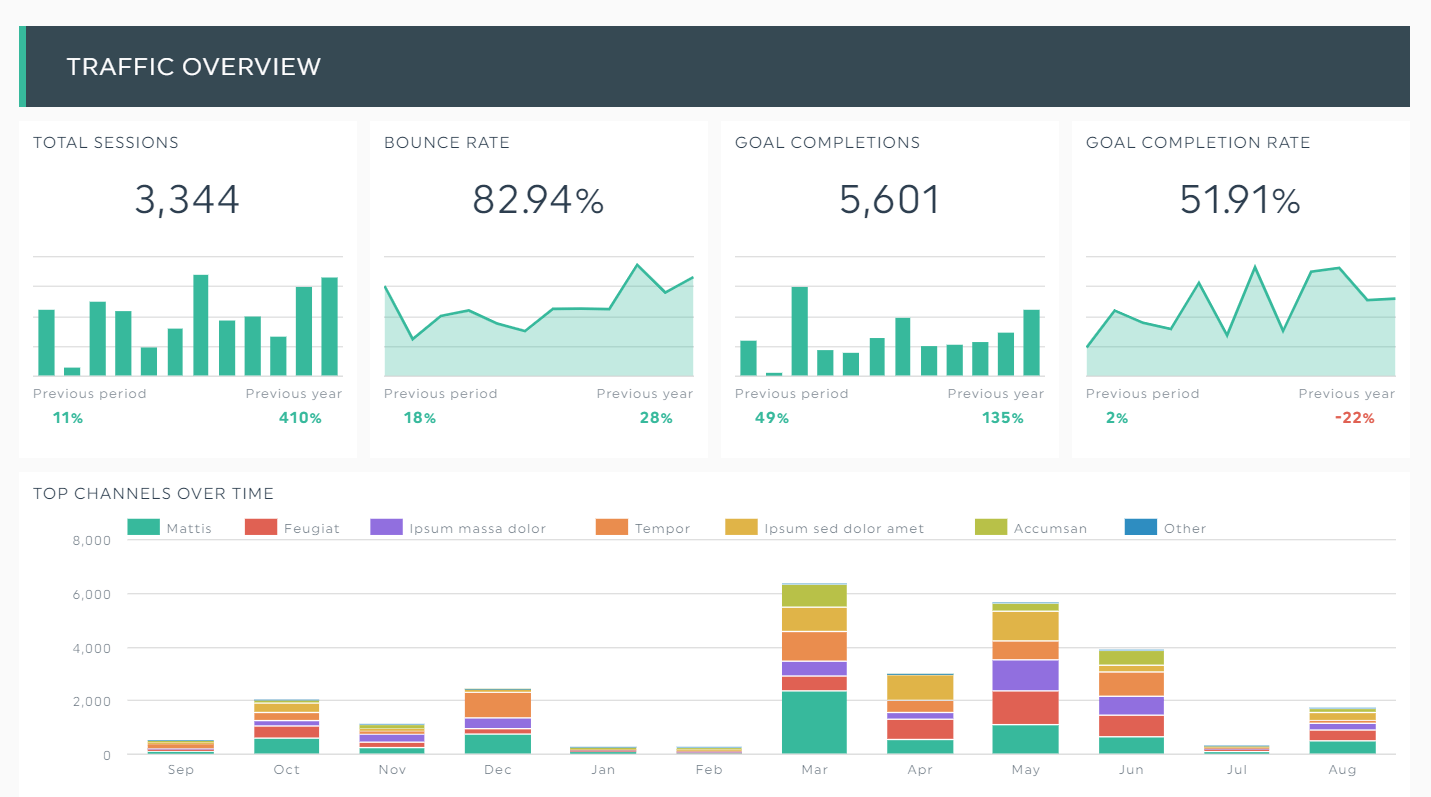
One of the most crucial features of a data dashboard is its ability to present data in a visually appealing and interactive manner. By incorporating interactive data visualization tools such as charts, graphs, and maps, you can transform raw data into meaningful insights. Users can explore the data, drill down into specific details, and gain a deeper understanding of the trends and patterns.
For example, you can use line charts to showcase sales performance over time, bar charts to compare different product categories, and heat maps to highlight geographical variations. The interactive nature of these visualizations allows users to interact with the data directly, enabling them to make informed decisions quickly.
We recently created a dashboard for axle boxes and wheel tracking for a client at GeekyAnts. Check it out!
Real-time Data Updates
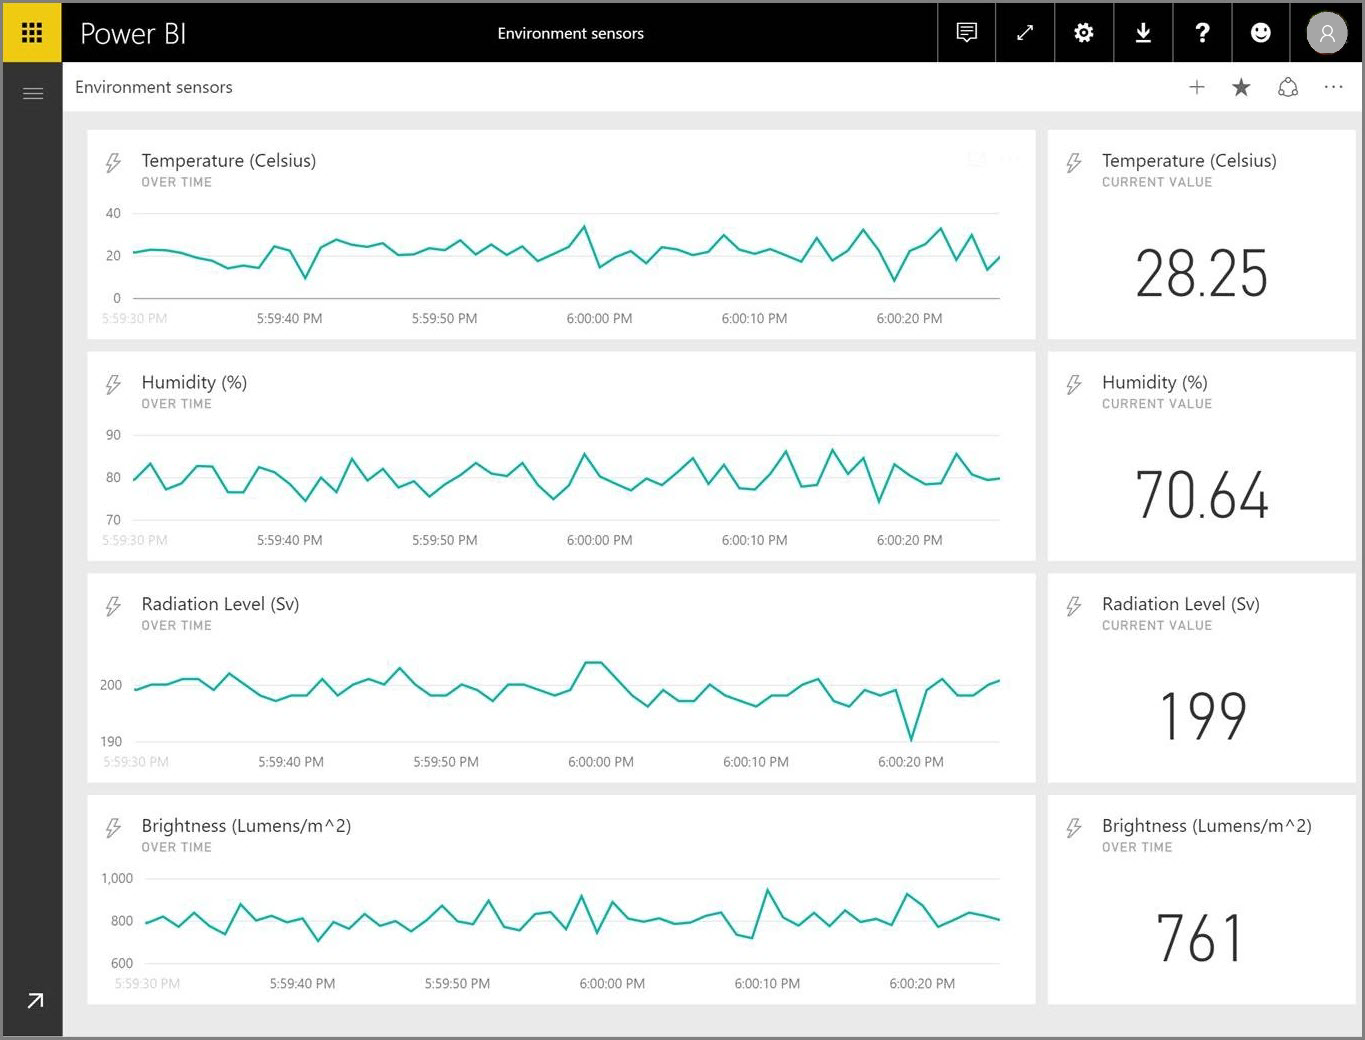
Your dashboard app should be capable of seamlessly integrating with various data sources and updating the information in real-time. This ensures that the insights presented on the dashboard are always up-to-date and reflect the current state of your business.
Real-time data updates empower monitoring of key metrics, including:
- Identifying emerging trends promptly with real-time data.
- Responding to anomalies swiftly with up-to-the-minute information.
- Tracking website traffic, social media engagement, or sales figures effortlessly.
- Timely and informed decision-making facilitated by real-time data access.
Customisable Dashboards
Every business has unique needs and requirements when it comes to data analysis. Your dashboard app should offer extensive customization options, allowing you to tailor the layout, design, and functionality to suit your specific preferences.
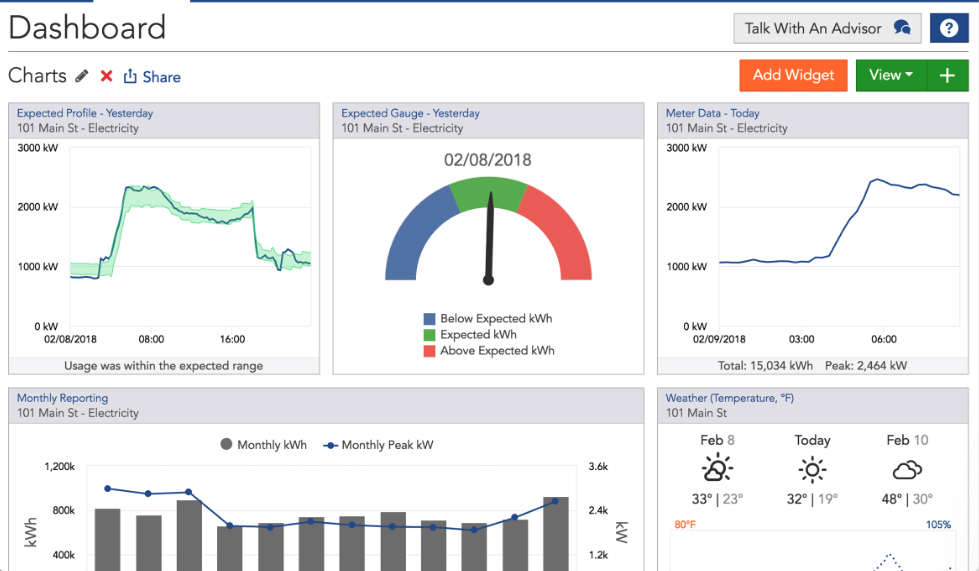
Customizable dashboards enable you to focus on the metrics that matter most to your business. You can arrange widgets and visualizations in a way that provides a clear and intuitive overview of your data. Whether you prefer a minimalist design or a more detailed layout, the ability to customize your dashboard ensures that it aligns perfectly with your business goals.
Data Filtering and Drill-down
When dealing with large volumes of data, it's essential to have the ability to filter and drill down into specific subsets of information. Your dashboard app should allow users to apply filters and explore the data at various levels of granularity.
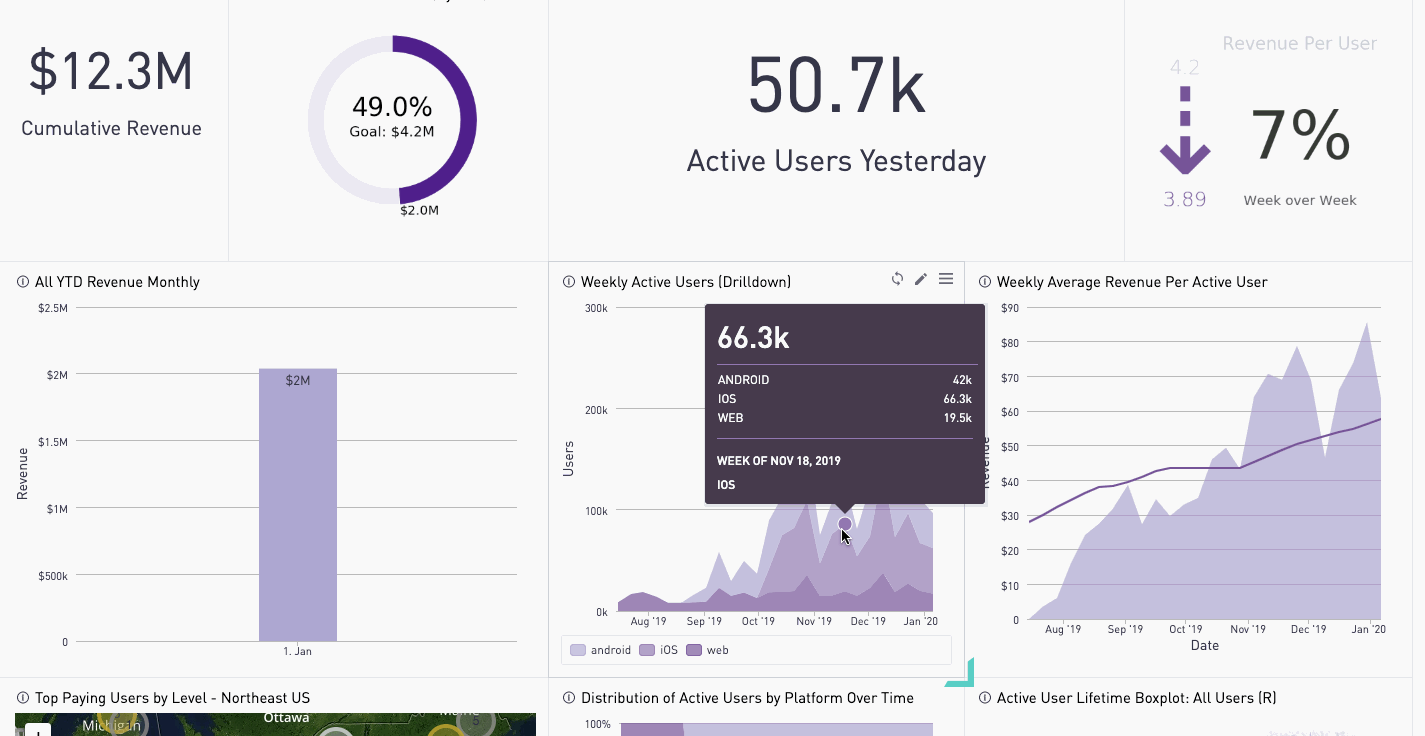
For example, users should be able to filter data based on specific time periods, geographical regions, product categories, or any other relevant criteria. Additionally, the ability to drill down into detailed information provides a deeper understanding of the underlying factors influencing the metrics. This level of flexibility and granularity empowers users to uncover hidden insights and make data-driven decisions with confidence.
Alerts and Notifications
Staying informed about critical changes in your data is vital for proactive decision-making. Your dashboard app should include an alerting system that notifies users when specific KPIs or metrics cross predefined thresholds.
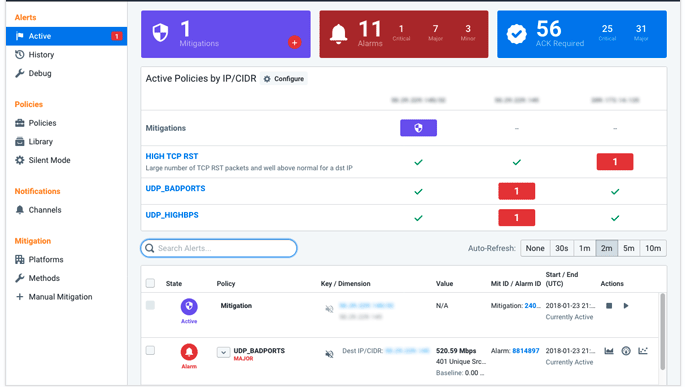
By setting up alerts and notifications, you can ensure that you are promptly notified of any significant deviations from expected performance. For example, if sales drop below a certain threshold or website traffic spikes unexpectedly, you can take immediate action to address the issue. Alerts and notifications keep you informed and enable you to respond swiftly to changing circumstances.
User Access Control
Not all users require access to the same level of data and functionality. Your dashboard app should provide robust user access control features, allowing you to define roles and permissions for different user groups.
With user access control, you can ensure that each user sees only the relevant data and features based on their role within the organization. For example, managers may have access to all metrics and the ability to create custom reports, while individual team members may have limited access to specific data sets. User access control enhances data security, streamlines workflows, and ensures that users can focus on the information that is most relevant to their responsibilities.
Mobile Compatibility
In today's mobile-driven world, it's essential to have access to your data anytime, anywhere. Your dashboard app should be compatible with mobile devices, allowing users to view and interact with the data on smartphones and tablets.
Mobile compatibility ensures that you can stay connected to your business metrics even when you are on the go. Whether you are attending a meeting, traveling, or simply away from your desk, you can access your data dashboard from the palm of your hand. This flexibility enables you to make informed decisions and stay in control of your business, no matter where you are.
Data Export and Sharing
Sharing insights and collaborating with stakeholders is an integral part of data analysis. Your dashboard app should provide easy-to-use data export and sharing capabilities, allowing you to share reports, visualizations, and raw data with others.
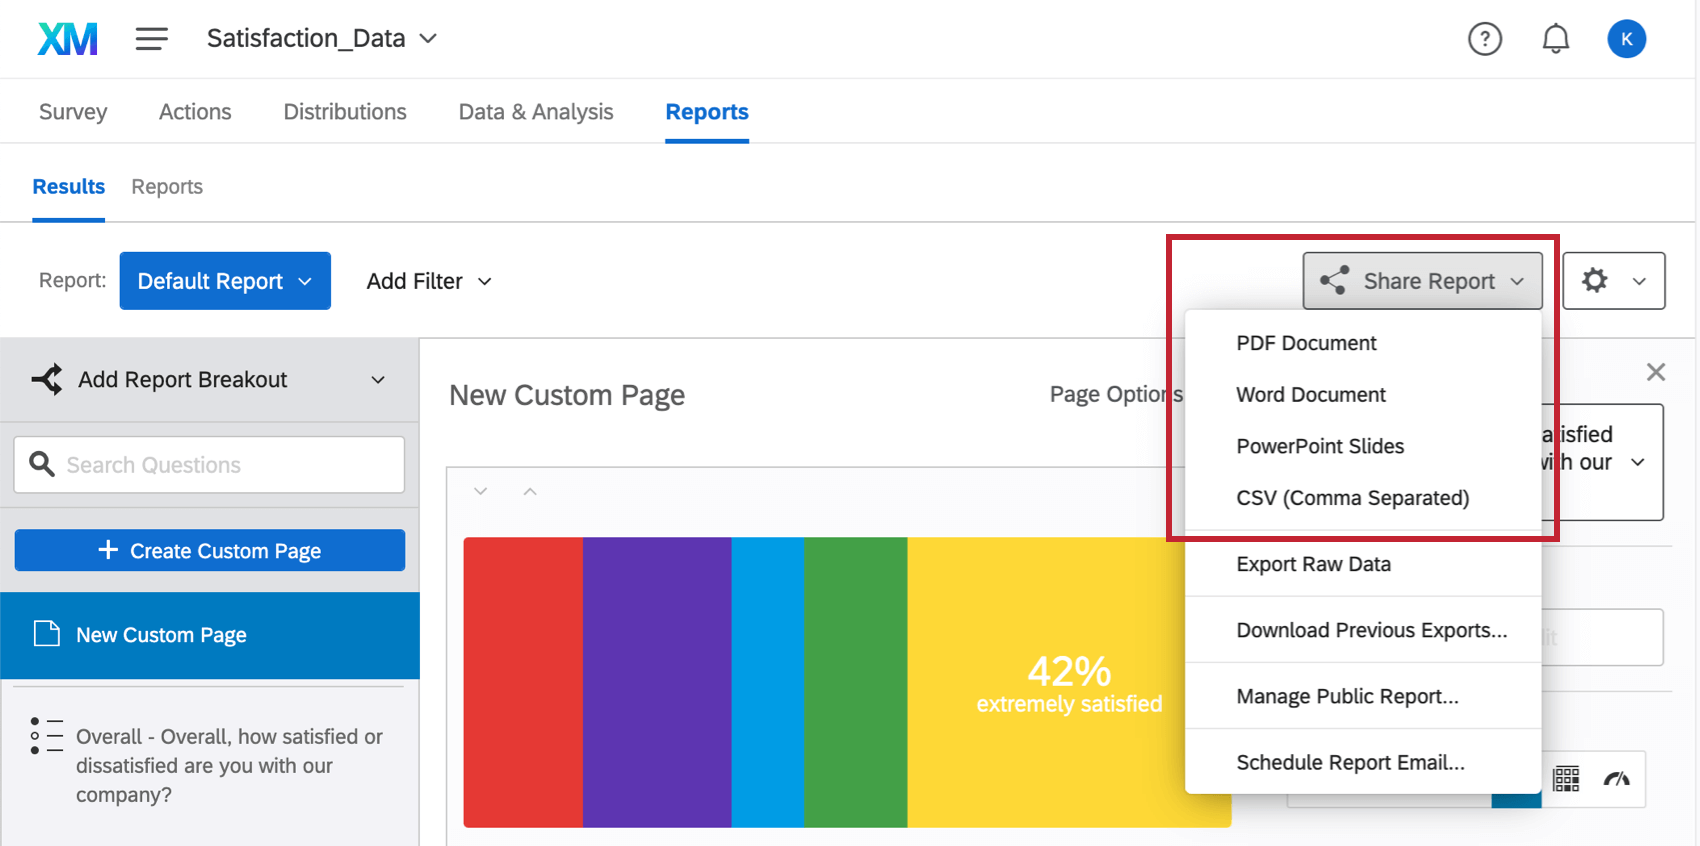
Whether it's exporting data to Excel, generating PDF reports, or sharing interactive dashboards with colleagues, the ability to export and share data promotes collaboration and facilitates data-driven discussions. By enabling others to access and explore the data, you can foster a culture of data-driven decision-making within your organization.
Performance Optimisation
A high-performing dashboard app is essential for a smooth and efficient user experience. Your dashboard app should be optimized to handle large volumes of data and deliver fast response times.
Performance optimization involves various techniques, such as data caching, query optimization, and efficient data retrieval. By ensuring that your dashboard app is optimized for speed and responsiveness, you can provide users with a seamless experience, even when dealing with complex data sets.
In conclusion, building a custom data dashboard app tailored to your specific needs can provide immense value to your business. By incorporating the top 10 key features discussed in this article, you can create a powerful and insightful data dashboard that empowers you to make data-driven decisions with confidence. Remember, the right combination of features will depend on your unique requirements and objectives. So, take the time to evaluate your needs and choose the features that will best serve your business.
Top 10 Key Features Your Custom Data Dashboard App Must Have
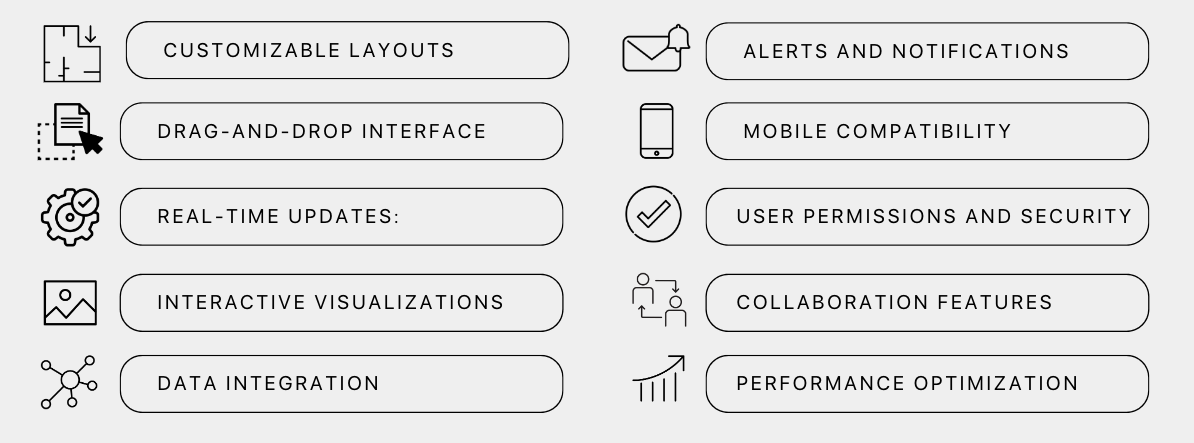
In order to make the most of your custom data dashboard app, consider including these key features:
- Customizable Layouts: Tailor dashboards to specific needs with customizable layout, design, and content.
- Drag-and-Drop Interface: Easily add, remove, and rearrange widgets for a user-friendly experience.
- Data Integration: Connect to databases, APIs, and cloud services for a comprehensive business view.
- Real-Time Updates: Ensure always up-to-date data without manual refreshing.
- Interactive Visualizations: Explore and analyze data with interactive charts, graphs, and maps.
- Alerts and Notifications: Stay informed with alerts based on defined thresholds or conditions.
- Mobile Compatibility: Access dashboards on smartphones and tablets for on-the-go updates.
- User Permissions and Security: Ensure data confidentiality with role-based access controls and encryption.
- Collaboration Features: Enhance productivity with data sharing, commenting, and version control.
- Performance Optimization: Handle large datasets and complex queries with fast loading times and smooth interactions.
How to Select the Best Dashboard Software?
Now that we have discussed the key features you should include in your custom data dashboard app, let's explore how to select the best dashboard software for your organization. Here are some factors to consider.

What Are the Types of Custom Dashboards GeekyAnts Can Build?
If you are looking for a software development company to build your custom data dashboard app, GeekyAnts can offer various types of custom dashboards tailored to your business requirements.
We specialize in building interactive and visually appealing dashboards in the following domains:
- Business Intelligence (BI) Dashboards: BI dashboards provide insights and analytics on various business aspects, helping organizations make data-driven decisions.
- Marketing Dashboards: Marketing dashboards focus on key marketing metrics and help businesses track campaign performance, customer acquisition, and ROI.
- Sales Dashboards: Sales dashboards provide real-time information on sales performance, revenue, and customer metrics, enabling sales teams to track progress and identify trends.
- Financial Dashboards: Financial dashboards help businesses monitor financial performance, cash flow, expenses, and other financial metrics in real-time.
- Operational Dashboards: Operational dashboards track operational metrics such as production, inventory levels, resource utilization, and quality control.
GeekyAnts has extensive experience in building custom dashboards across these domains, ensuring that your dashboard app is tailored to your specific industry and business needs.
Conclusion
In conclusion, a custom data dashboard app can greatly enhance your organization's decision-making process by providing real-time access to critical information. By including key features such as customizable dashboards, data integration, real-time updates, and interactive visualizations, you can create a powerful tool that empowers your team and enables data-driven decisions. When selecting a dashboard software, consider factors like usability, scalability, data integration, visualization options, and data security.
If you need assistance in building a custom dashboard, GeekyAnts can provide expertise in various types of dashboards. Start maximizing the value of your data with a custom data dashboard app in 2024.
Related Articles
Dive deep into our research and insights. In our articles and blogs, we explore topics on design, how it relates to development, and impact of various trends to businesses.
