Aug 21, 2024
Remote debugging in Heroku
Discover how to easily set up remote debugging for your Node.js app on Heroku, and diagnose issues like a pro with our step-by-step guide!
Author


Book a call
Table of Contents
Hey there, fellow coder! Have you ever wished you could just step through your Node.js app running on Heroku like a local app? Well, grab your favorite drink and get comfy because we’re about to embark on a fun journey to set up remote debugging on Heroku!
Why Remote Debugging?
Debugging is a crucial part of development, ensuring your app runs smoothly and efficiently. Remote debugging is especially important when your app is deployed on a server, allowing you to diagnose issues that only appear in a deployed environment.
Prerequisites
Before we jump in, make sure you have:
- A Node.js application deployed on Heroku.
- The Heroku CLI installed on your machine.
Debugging Steps
Step 1: Enable Remote Debugging
First, we need to enable remote debugging for your Node.js app. Heroku uses the inspect flag to allow remote debugging.
- Modify Your
Procfile: Add the--inspectflag to yourProcfile. It should look something like this:
2. Deploy Changes to Heroku: Commit your changes and push to Heroku:
Step 2: Open a Remote Debugging Session
Now that your app is configured, it’s time to connect to the remote debugger.
- Restart Your Heroku App: Restarting ensures the
inspectflag is applied:
2. Forward Debugging Port: Forward traffic on a local port to a port inside a dyno; in this case both the local port and dyno port are 9229:
Step 3: Connect Your Debugger
With the SSH tunnel set up, you can now connect your favourite debugger.
Using VS Code
- Open VS Code: Launch VS Code and open your project.
- Configure Debugger: Add a new configuration in your
launch.json:
3. Start Debugging: Select the "Attach to Heroku" configuration and start debugging. Set breakpoints, inspect variables, and step through your code like in a local environment.
Using IntelliJ IDEA / Webstorm
- Open Run Config: Open your IDE and go to
Run > Edit Configurations. - Configure Debugger: Click the
+button and selectAttach to Node.js/Chrome:
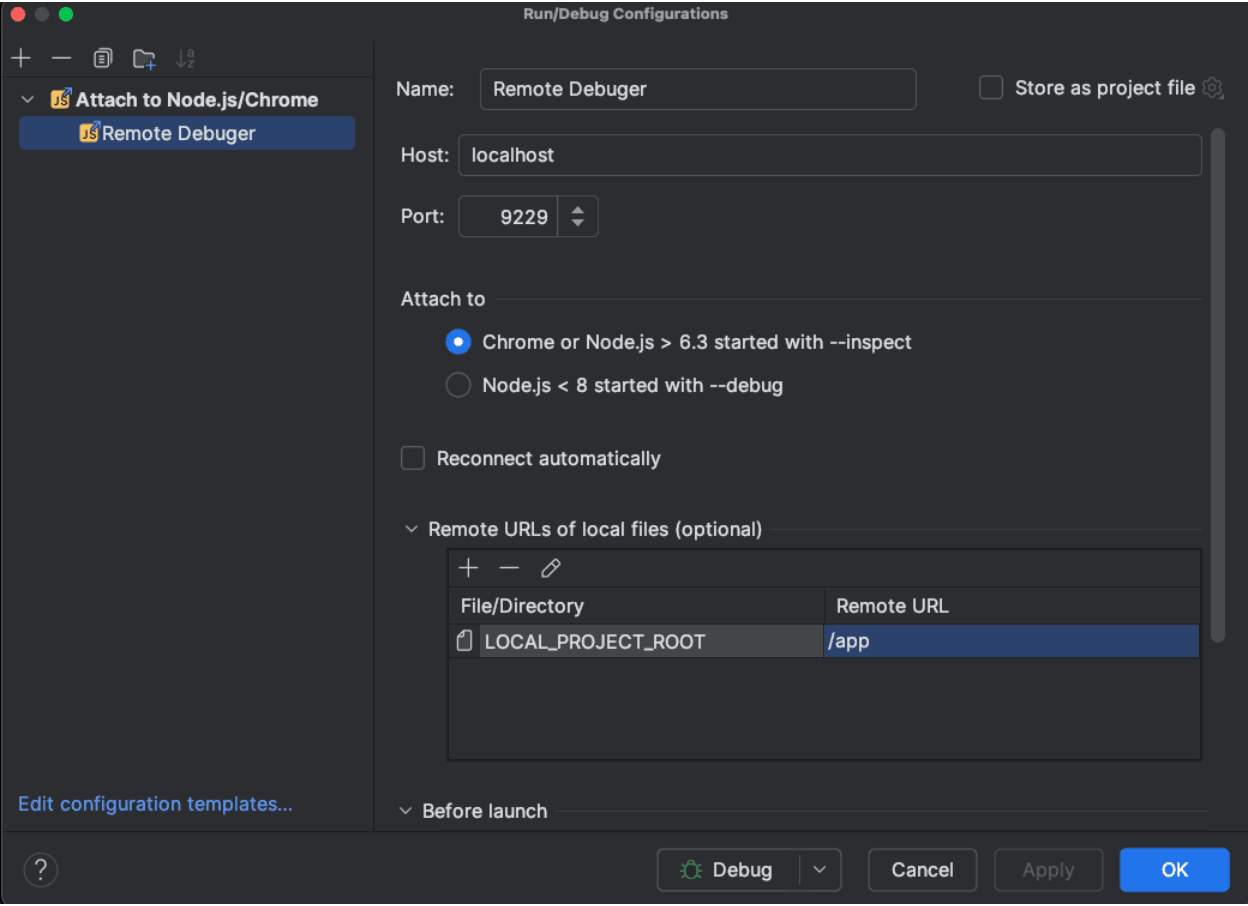
3. Start Debugging: Select your newly created Node.js Remote Debug configuration, Click the debug icon and start debugging. Set breakpoints, inspect variables, and step through your code like in a local environment.
And there you have it! You’ve just set up remote debugging for your Node.js app on Heroku. High five! Debugging in the cloud just became a whole lot cooler, right? If you hit any bumps along the way, double-check your SSH tunnel and configurations. Happy debugging!
Subscribe to Our Newsletter
Subscribe to RSS
Press & Media Hub RSS FeedRelated Articles.
More from the engineering frontline.
Dive deep into our research and insights on design, development, and the impact of various trends to businesses.

Jul 10, 2026
How We Built the Missing Bridge from Code to Figma

Jun 27, 2026
Building a Resilient Hybrid-Cloud Network with WireGuard HA, Route-Based Failover, and Deep Observability

Jun 19, 2026
We Built a 114-Second AWS-to-Azure Failover. Here’s What We Learned

Jun 12, 2026
Cloud-Native and Cloud-Agnostic Are Not Ideologies; They Are Business-Stage Decisions

Jun 8, 2026
Geeklego: The Open-Source Design System Built to Work With AI

May 18, 2026