What is Performance Testing?
Performance testing is a crucial aspect of software development that evaluates how an application behaves under various conditions and loads. It includes several types of testing, such as load testing, stress testing, and endurance testing. The goal is to ensure that the application performs well under expected and peak loads, providing a smooth user experience and maintaining reliability.

Why is Performance Testing Important?
Load testing is the process of simulating real-world user traffic on your application to see how it performs under pressure. It helps you:
- Identify Bottlenecks: Discover which parts of your application (database queries, API endpoints, specific views) slow down under load.
- Ensure Scalability: Understand how many concurrent users your current setup can handle and plan for growth.
- Prevent Crashes: Find breaking points before your users do.
- Improve User Experience: Ensure your app remains fast and responsive, even during peak times.
About Locust
Any application's performance must be evaluated and improved through load testing. We utilise it to assess whether our application can survive the demands of actual use. Locust is a potent tool in every developer's toolbox for efficient load testing. With this free, open-source Python programme, you can simulate millions of concurrent users and describe user behaviour using Python code. This article will serve as your comprehensive, example-filled guide to load testing using Locust.
What is a Locust?
Locust is a distributed, scalable, and user-friendly load testing tool. Simulating traffic patterns aids engineers in understanding how many concurrent users a system can support. The key benefit of using Python code to describe user behaviour is that Locust is extremely flexible and configurable.
Installing Locust
Ensure you have Python 3.6 or higher installed before installing Locust. Pip may then be used to install Locust:
pip install locustGetting Started with Locust
You must provide user behaviour in a Python file to utilise Locust for the first time. The actions that the simulated users will take are listed in this file, which is sometimes called locustfile.py.
from locust import HttpUser, task, between


class MyUser(HttpUser):
   wait_time = between(1, 3)


   @task
   def hello_world(self):
       self.client.get("/")
In this illustration, the behaviour of a simulated user is defined by WebsiteUser. The homepage task is executed after the user has waited between 5 and 15 seconds (wait_time = between(5, 15)) and sends a GET request to the home page (self.client.get("/")).
Running a Locust Test
Navigate to the directory containing your locustfile.py and issue the locust command to conduct a Locust test:
locust -f sample.pyThe web interface for Locust then launches, and its address is http://localhost:8089. Here, you can define the destination website, the total number of users to simulate, and the spawn rate.
Open http://localhost:8089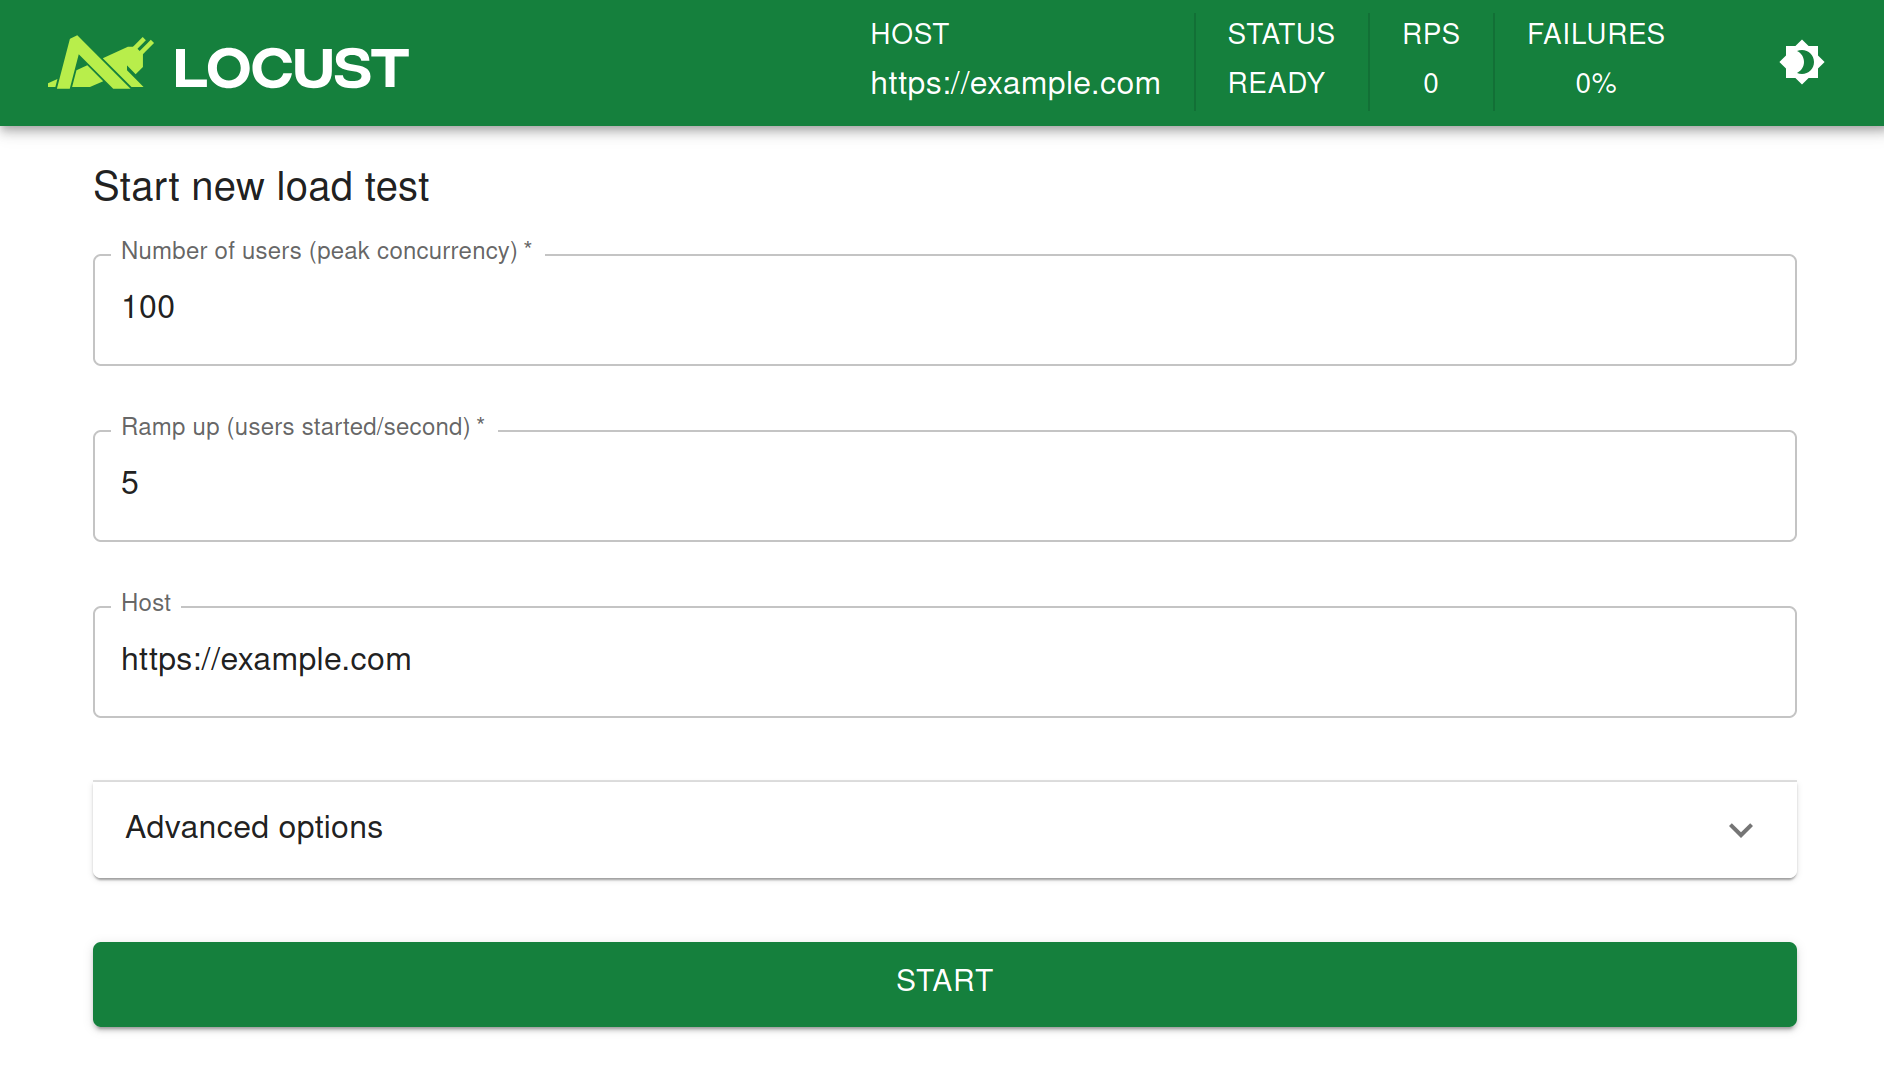
Provide the hostname of your server and try it out!
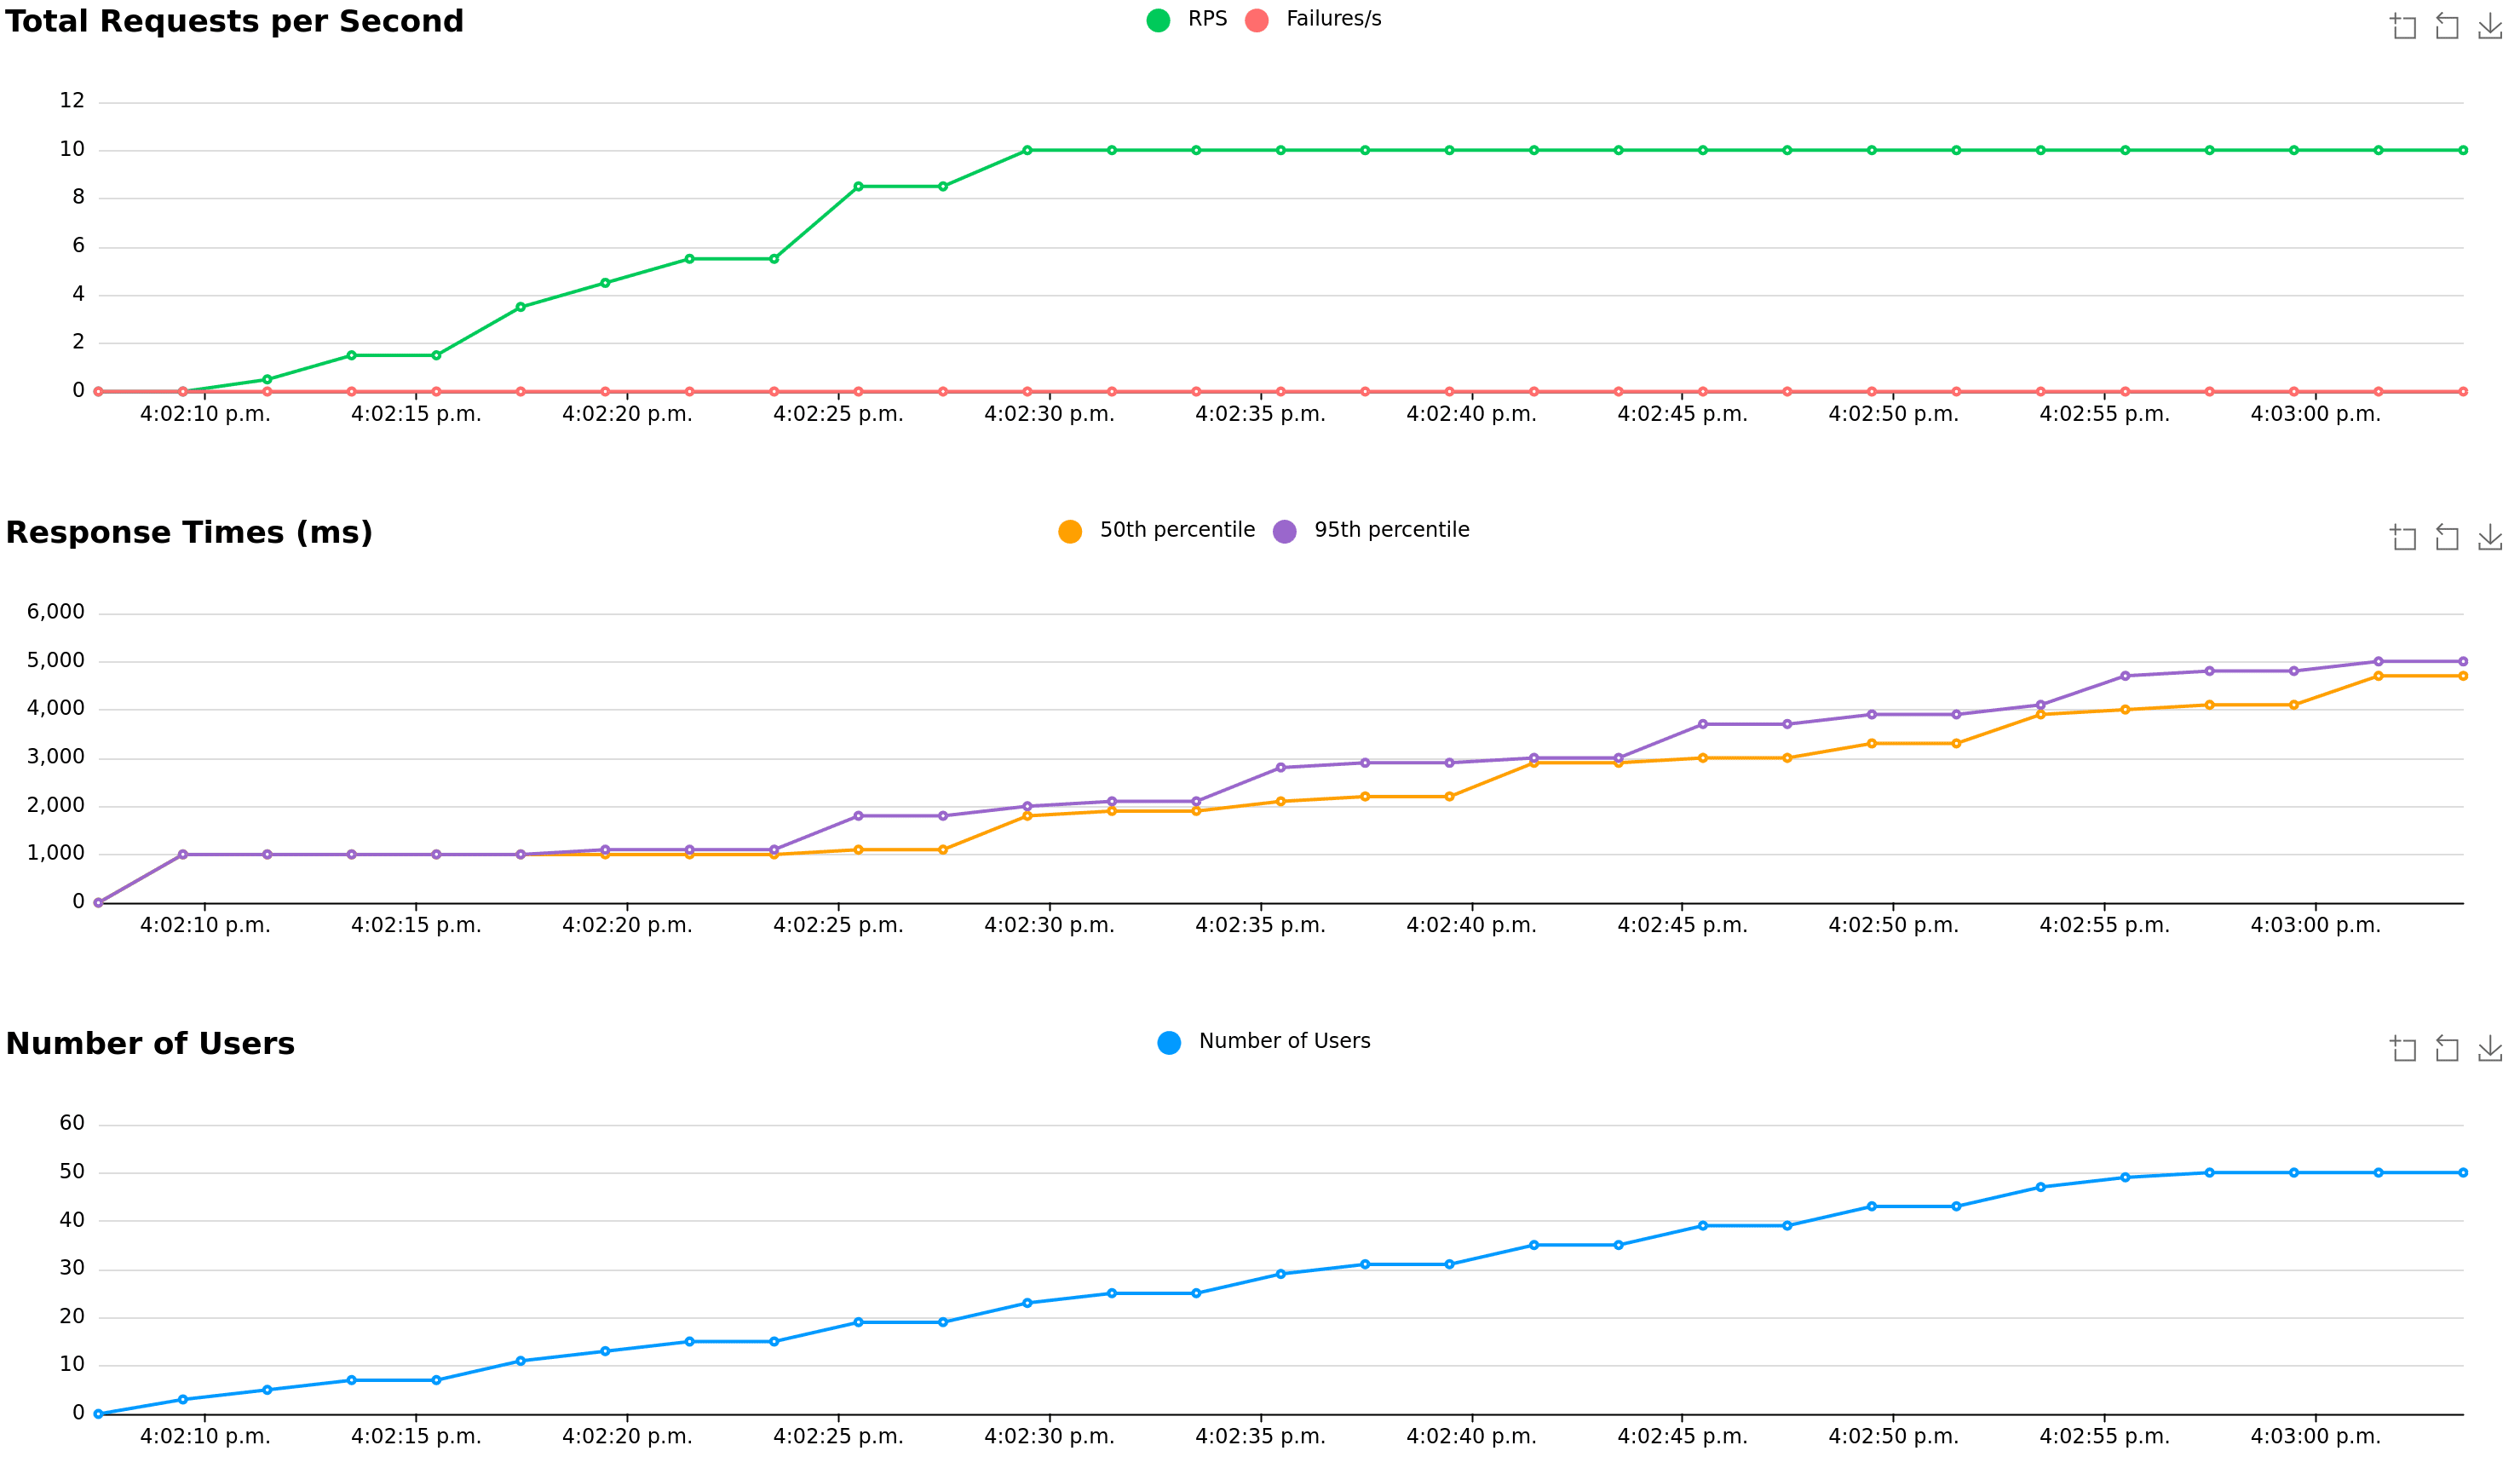
The following screenshots show what it might look like when running this test using 50 concurrent users, with a ramp-up rate of 1 user/s
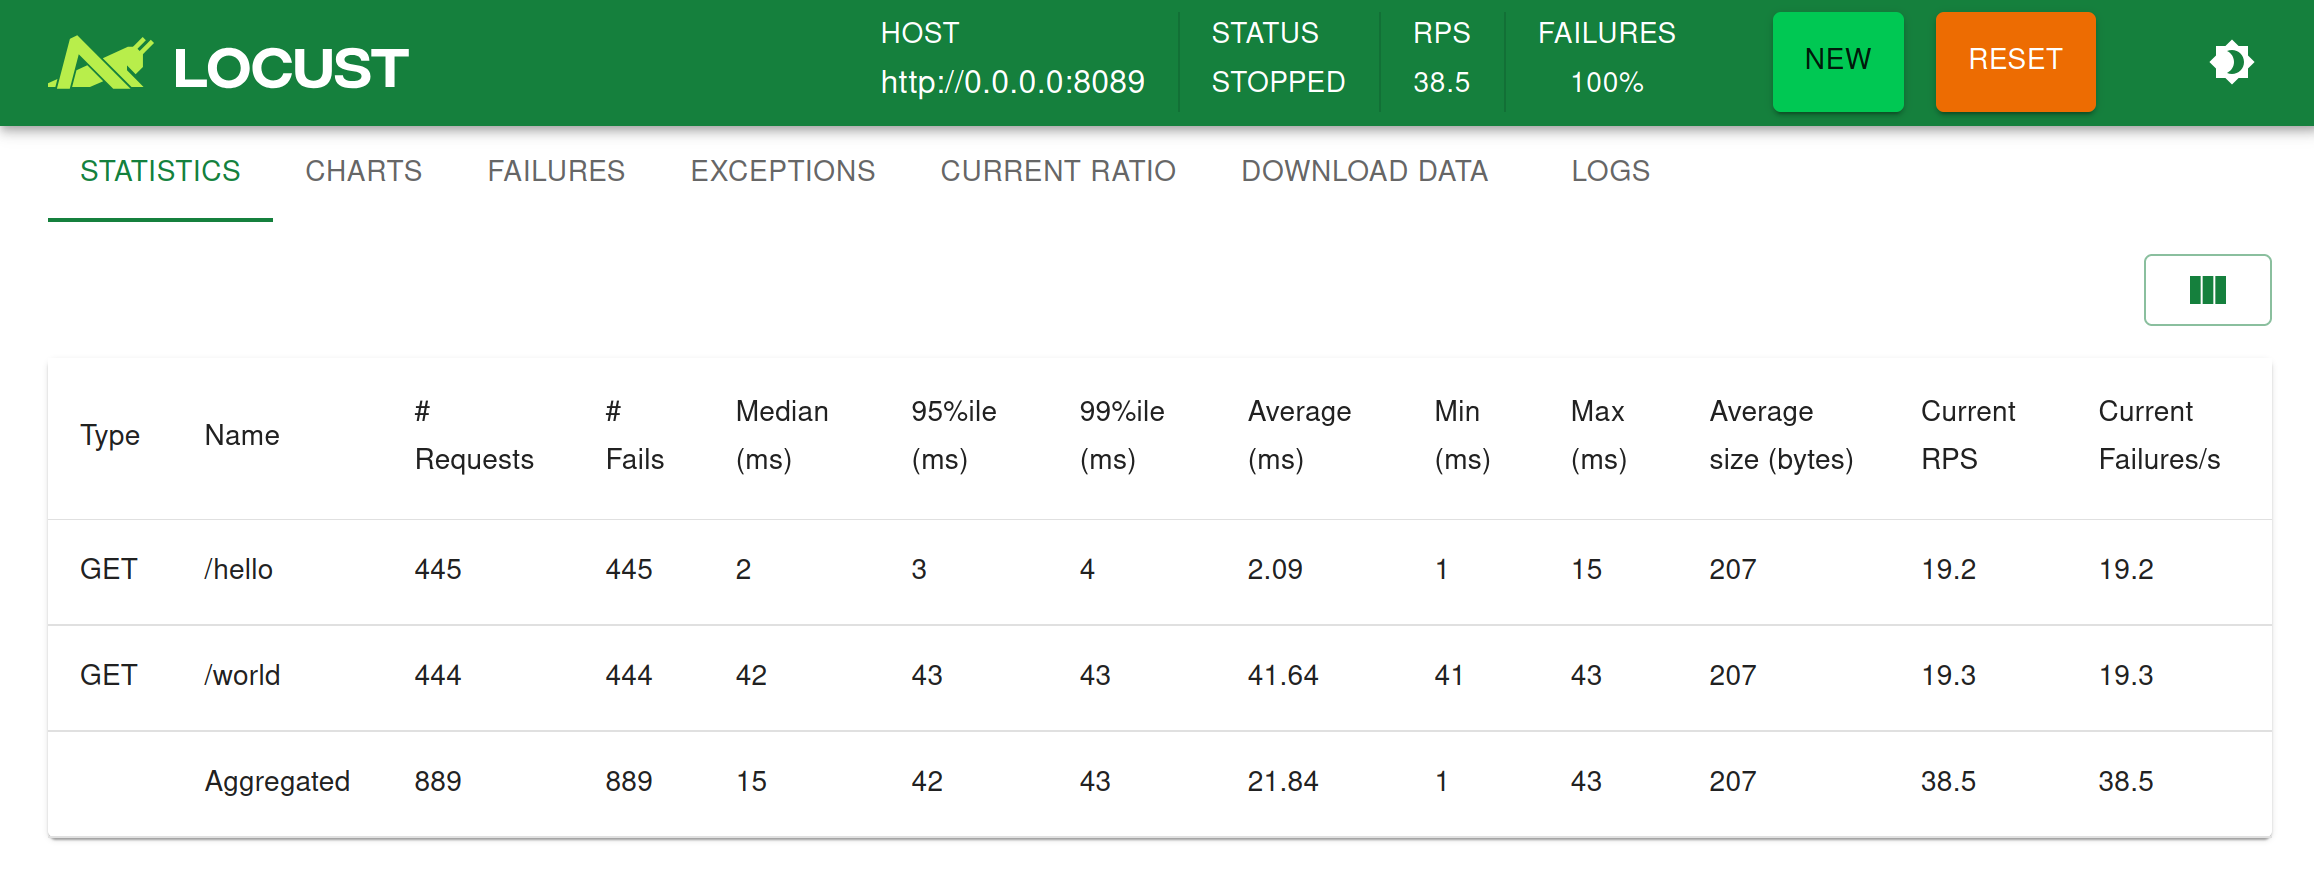
Under the Charts tab, you’ll find things like requests per second (RPS), response times and number of running users:
Direct command line usage / headless
Using the Locust web UI is entirely optional. You can supply the load parameters on the command line and get reports on the results in text form:
locust --headless --users 10 --spawn-rate 1 -H http://your-server.com
[2021-07-24 10:41:10,947] .../INFO/locust.main: No run time limit set, use CTRL+C to interrupt.
[2021-07-24 10:41:10,947] .../INFO/locust.main: Starting Locust 2.37.12
[20
21-07-24 10:41:10,949] .../INFO/locust.runners: Ramping to 10 users using a 1.00 spawn rate
Name              # reqs      # fails  |     Avg     Min     Max  Median  |   req/s failures/s
----------------------------------------------------------------------------------------------
GET /hello             1     0(0.00%)  |     115     115     115     115  |    0.00    0.00
GET /world             1     0(0.00%)  |     119     119     119     119  |    0.00    0.00
----------------------------------------------------------------------------------------------
Aggregated             2     0(0.00%)  |     117     115     119     117  |    0.00    0.00

[2021-07-24 10:44:42,484] .../INFO/locust.runners: All users spawned: {"HelloWorldUser": 10} (10 total users)
More about running without a web UI
Key Differences Between Locust, K6, and JMeter

Feature | k6 | Locust | JMeter |
|---|---|---|---|
Scripting language | Python | GUI-based; optional Beanshell/Groovy scripting | |
Developer-Friendly | Designed for developers with a clean API | Highly flexible with python scripting | Less developer-friendly; GUI-based with scripting as an add-on |
GUI Interface | CLI & Cloud/Grafana dashboards | Web-based dashboard | Full graphical UI |
Real-Time Monitoring | Grafana/Cloud integrations | Built-in web UI | Basic GUI reports; needs plugins for advanced monitoring |
CI/CD Integration | Native support for pipelines (GitHub Actions, Jenkins, etc.) | Possible with scripts and tools | Requires extra setup and plugins |
Protocol Support | HTTP/HTTPS (limited other protocol support) | HTTP/HTTPS (extensible via Python) | HTTP, FTP, JDBC, SOAP, JMS, and more |
Custom Scenarios | JavaScript-based flow control | Python-based; excellent for complex logic | Limited to GUI flows or custom scripts |
Scalability | Supports distributed & cloud testing | Can simulate millions of users | Scales with effort; memory-intensive |
Resource Usage | Lightweight | Efficient, low hardware footprint | Heavy memory usage on large tests |
Performance Metrics | Rich metrics, InfluxDB/Grafana integration | Real-time metrics in the dashboard | Basic by default; extensible with plugins |
Distributed Testing | Native support via k6 Cloud or output streaming | Via worker nodes, easily configured | Via remote servers, but requires configuration |
Best Use Case | API load testing, DevOps pipelines, scalable and scriptable load tests | Scalable web app testing, custom behavior scripting | Broad protocol support, functional + load testing, GUI-centric teams |
Best Practices for Performance Testing
- Define Clear Objectives: Establish what you want to achieve with performance testing, including setting benchmarks, understanding acceptable load thresholds, and identifying critical metrics.
- Test in a Production-Like Environment: Conduct tests in an environment that closely mirrors your production setup to get accurate and actionable results.
- Use Realistic Test Data: Utilize data that represents real-world usage patterns, including a mix of user types, transactions, and data sizes.
- Automate Testing: Integrate performance testing into your CI/CD pipeline to catch performance regressions early and ensure every deployment is automatically tested.
- Analyze and Act on Results: Collect and analyze performance data to identify bottlenecks and areas for improvement, optimizing your application and infrastructure accordingly.
Conclusion:
Locust is a versatile and powerful tool for load testing, offering flexibility through Python scripting and ease of use with its web-based interface. Whether you are stress testing a simple web application or a complex API, Locust provides the necessary tools to simulate real-world traffic and identify performance bottlenecks. Its scalability ensures that it can handle projects of any size, making it an essential tool in the arsenal of performance engineers.
By leveraging Locust, teams can proactively address performance issues, ensuring that their systems remain robust and responsive under peak loads.