

Demo example app: github.com/manuindersekhon/flutter-image-memory-demo
AI-assisted teams now ship correct code faster than ever. But this article is about a class of failure that is not in the code at all. It lives in the gap between what the code says and what the device actually does. And that gap is exactly where all the velocity we gained gets eaten back.
The Bug Report That Made No Sense
Some time back, one of our production apps had a leaderboard. A simple, scrollable list of 100+ players, each row with a name, a score, and a 50x50 profile picture. Nothing fancy.
Then the bug reports started coming in.
“The leaderboard page keeps refreshing on Safari.” “The app closed by itself on my iPhone while scrolling.” No error in the console. No crash log with a stack trace. Nothing reproducible on our development machines. The page would simply reload on Safari as if the user had pressed refresh, and on iOS the app would just disappear.
Two different platforms, two different symptoms, and as it turned out, one single bug. One that no code review could have caught.
The Code That Passed Review
Here is the code at the centre of it. This is roughly what our leaderboard row looked like:
ListTile(
  leading: CircleAvatar(
    radius: 25,
    backgroundImage: NetworkImage(user.avatarUrl),
  ),
  title: Text(user.name),
)
Take a moment and review it. It compiles. It is an idiomatic Flutter, straight from the documentation. The analyzer is happy. It renders perfectly on the MacBook and in every demo. Whether a teammate wrote it or an AI agent generated it, any of us would have approved this diff.
Nothing in the code is wrong. The defect only exists at the intersection of three layers that no code-level reviewer is looking at: what the backend serves, what the image decoder does with it, and what the device does when memory runs out.
Layer One: What the URL Actually Returns
Our users uploaded their profile pictures from their phones. A modern phone camera produces a 12-megapixel image, around 4032x3024 pixels, a few MB of JPEG. Our backend stored it exactly as uploaded, and the avatar URL served it exactly as stored.
The UI contract says “50 pixel avatar”. The API contract says “whatever the user uploaded”. There is no type system, no lint rule, and no review checklist that connects these two, and that mismatch travels silently all the way to the user's device.
Layer Two: File Size Is Not Memory Size
This is the part of image handling that is easy to forget. A JPEG is a compressed format, but a screen cannot draw compressed bytes. Before anything is rendered, the image is decoded into a raw bitmap: four bytes for every pixel.
So that 3 MB JPEG from the user's phone becomes 4032 x 3024 x 4 bytes, which is about 46.5 MB of memory. For one avatar. In a 50-pixel circle.
And here is the key Flutter behaviour: unless you tell it otherwise, Flutter decodes an image at its full intrinsic size, not at the size of the widget displaying it. The CircleAvatar's 50-pixel constraint never reaches the decoder. The full bitmap is decoded, kept, and scaled down on every frame.
To verify this, we built a small demo app that recreates the leaderboard and prints what the engine actually holds for each image. This is not theory, this is the app reporting its own image cache:
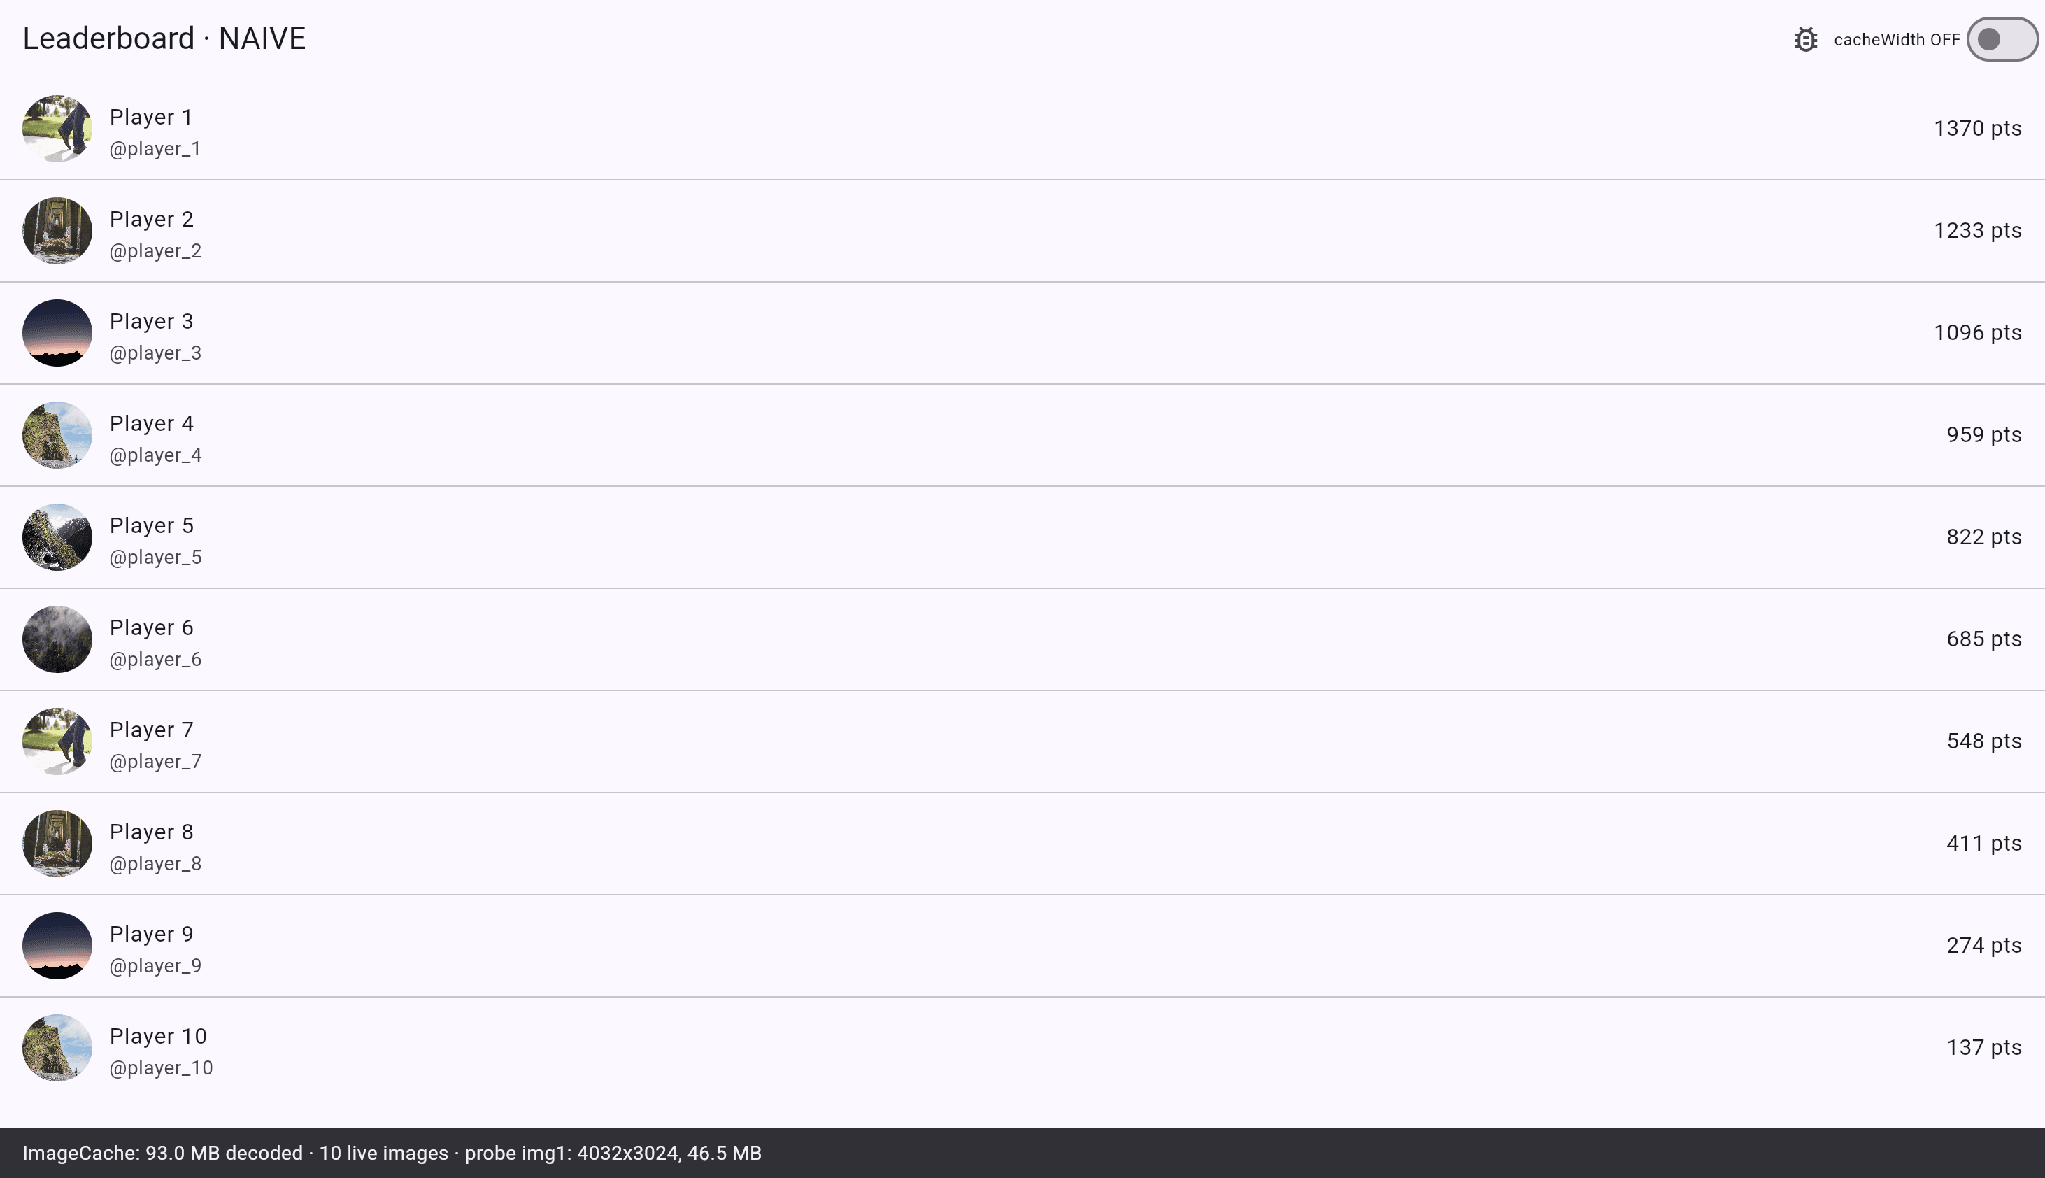
Multiply that by a leaderboard. Scrolling through 100+ entries asks the engine for several gigabytes of decoded bitmaps. Flutter's built-in image cache has a 100 MB budget, but that budget only applies to images that are no longer on screen. Images that are currently visible, or kept alive by the layout, are held regardless of it. The cap we were all silently relying on was never going to save us.
Layer Three: Every Platform Has a Ceiling, and They Are All Different
Here is where the story splits by platform, and where “works on my machine” stops being a joke and becomes the actual mechanism of the bug.
Chrome survives this abuse. It decodes images through a dedicated browser API into memory it can discard and re-decode at will. When we scrolled our naive leaderboard in Chrome, the tab stayed around a few hundred MB and nothing bad happened. This is exactly why the bug never appeared on our development machines.
Safari has no such decode path. The decoded bitmaps land inside the tab's own web content process, and WebKit enforces a hard memory budget on that process. On the same page, same scroll, Safari's process climbed to four times what Chrome used. Push further, and WebKit does exactly what its source code says it will do: it kills the web content process and reloads the page.
In our stress test, the process crossed 7 GB and was terminated, and the page came back fresh, exactly the “random refresh” our users reported. Safari even tells the user politely: “This webpage was reloaded because it was using significant memory.”
There is also a subtler symptom on iPads and iPhones. Before killing the page, WebKit fights back by purging decoded images. We watched the iOS Safari process balloon, get purged, and keep running with the leaderboard text intact but every avatar blank:
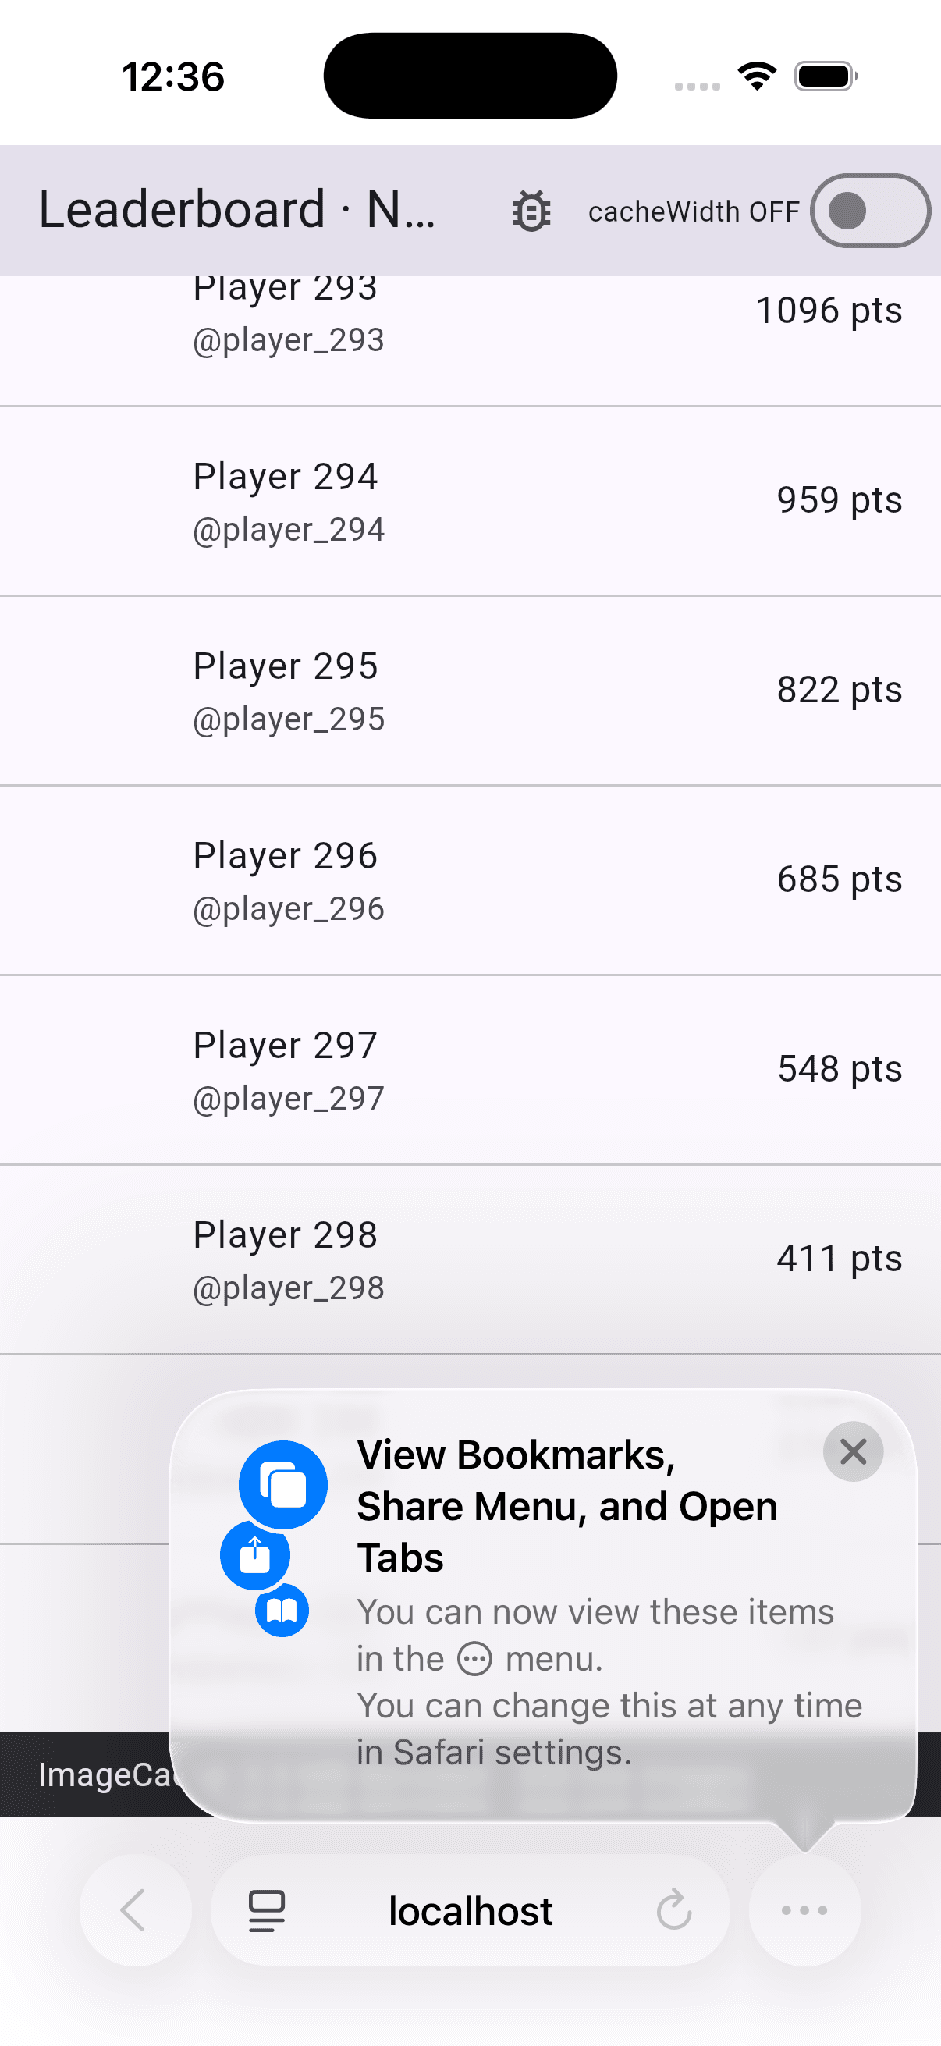
And the native iOS app? Same bug, different executioner. iOS enforces a per-app memory budget through a system called Jetsam. The budget depends on the device, community measurements put it under 1 GB on older iPhones and around 2 GB on mid-range ones. A leaderboard holding a few dozen 46 MB bitmaps alive walks into that limit within a couple of screen-heights of scrolling. The app is killed by the OS, not by your code. There is no Dart exception and no useful stack trace, and your crash reporting tool shows an “out of memory session” at best. That was our mysterious iOS crash.
One bug. Three ceilings. Three completely different symptoms.
Why Review Never Had a Chance
Now go back to that CircleAvatar snippet and ask: where in the diff is this bug?
It is not there. The reviewer sees idiomatic widget code. The tests see an image that renders. CI is green. The 46.5 MB number exists only at runtime, on a real device, with real production images. The defect is spread across three systems whose owners never appear in the same pull request: the upload pipeline that stores 12-megapixel photos, the framework default that decodes at intrinsic size, and the platform policy that kills the process.
This is also why the AI angle matters to us. An agent will write you this exact code, and it will be right by every static standard. An AI reviewer will approve it for the same reason a human does: the evidence is simply not in the artifact being reviewed. As AI compresses the cost of writing code, the defects that survive migrate to the layers that neither the agent nor the reviewer can see. The cost does not disappear. It moves to a production incident three weeks later, on a device you do not own.
The Fix Is One Parameter (and a Better One Upstream)
The immediate fix is embarrassingly small. Flutter lets you tell the decoder what size you actually need:
Image.network(
  url,
  width: 50, height: 50, fit: BoxFit.cover,
  cacheWidth: (50 * MediaQuery.devicePixelRatioOf(context)).round(),
)


// CircleAvatar has no sizing hook, so wrap the provider:
CircleAvatar(
  backgroundImage: ResizeImage(NetworkImage(url), width: 150),
)
With cacheWidth set, the same avatar decodes at 150 pixels instead of 4032. In our demo, that took each image from 46.51 MB down to 0.06 MB, roughly 775 times less memory, with zero visible difference in a 50-pixel circle. The whole leaderboard now fits in less than one megabyte of decoded images:
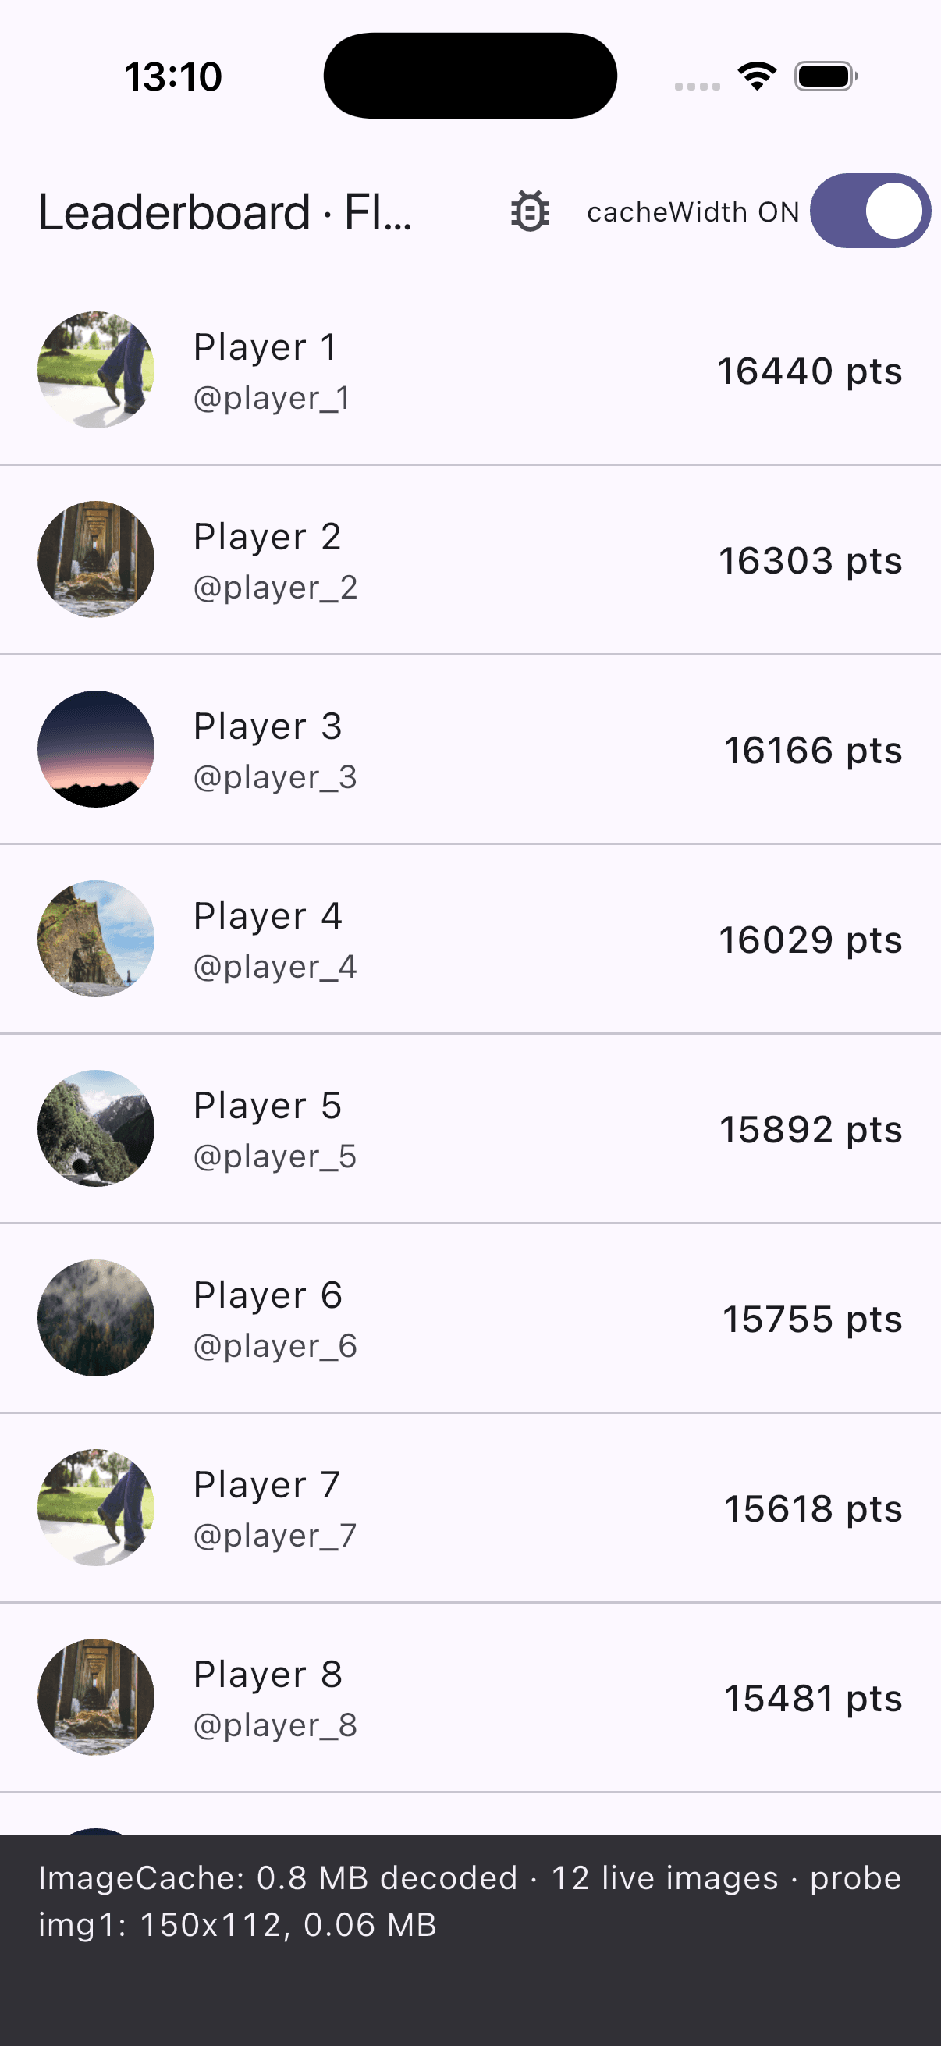
But honestly, the client-side parameter is the band-aid. The real fix is to never ship a 12-megapixel file to a 50-pixel widget in the first place: serve resized images from your CDN or an image proxy. That also fixes what cacheWidth cannot, because the full-size download and the browser-side decode of the original file still happen either way. Fix it at the source and every client, including the ones you have not written yet, gets it for free.
Making Sure It Never Comes Back
A bug that review cannot catch needs guardrails that do not depend on review.
The one we wish we had turned on earlier is built into Flutter itself. Set debugInvertOversizedImages to true in your debug builds, and the framework will flip and invert the colours of any image that was decoded significantly larger than its display size, and log the wasted bytes. Our leaderboard lit up like this:
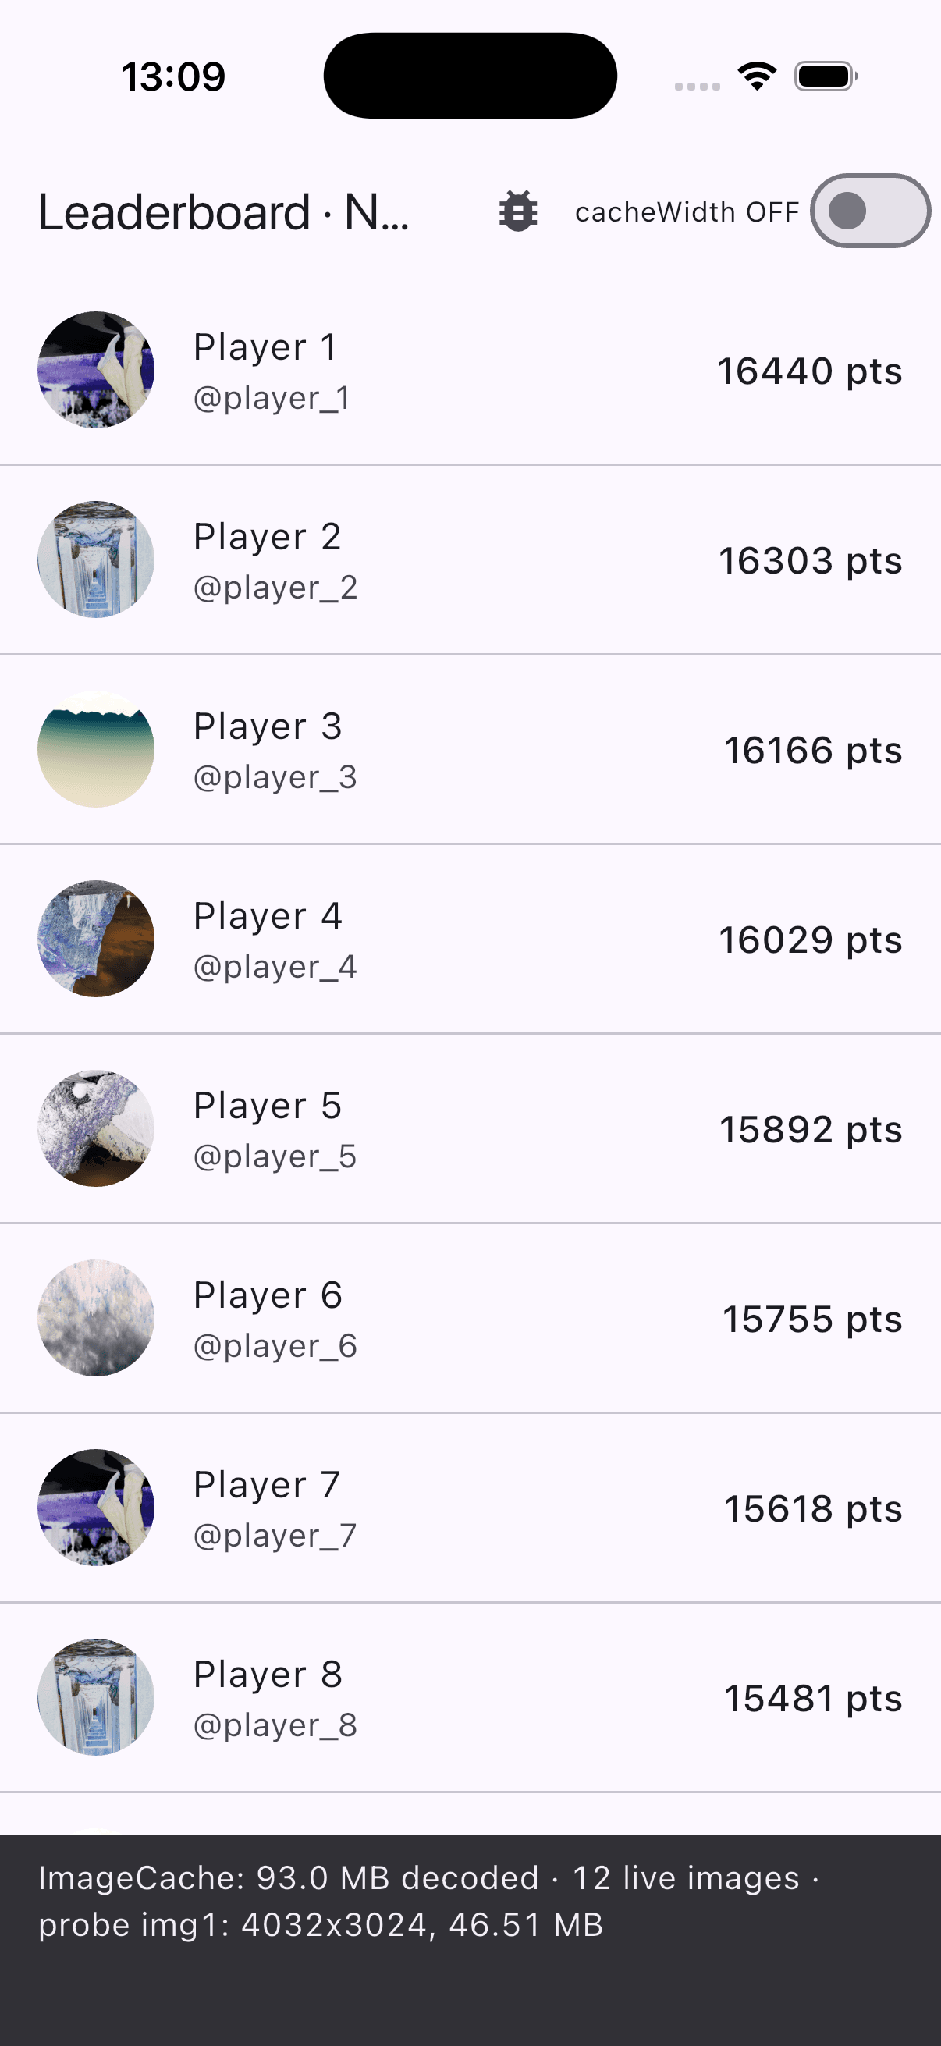
Beyond that flag, a few habits close the loop:
- Wrap remote images in one shared widget (an AppAvatar of your own) that requires a decode size, so the naive version cannot be written casually.
- Test on the smallest-RAM device you actually support, with production images, not neat little asset placeholders.
- When a “random refresh on Safari” or an “app just closed” report comes in, put memory on the suspect list before routing and state management.
Final Thoughts
The most interesting thing about this bug is how ordinary the code was. No clever trick went wrong, no obscure API was misused. A default did exactly what it was documented to do, on inputs nobody in the pull request could see, on devices with limits nobody in the pull request was thinking about.
AI has made the code layer cheap. It has not made the other layers cheap. The asset pipeline, the decoder, the memory ceilings of a five-year-old iPhone, someone on the team still has to own those. The teams that move fastest with AI will not be the ones that generate the most code. They will be the ones who know exactly which questions the diff cannot answer, and go looking for the evidence themselves.
The demo app used for every number and screenshot in this article is open source, and reproduces the whole story, including the Safari reload: github.com/manuindersekhon/flutter-image-memory-demo