
Elasticsearch is useful for searching an increasing dataset that starts adding pressure on the database and the application. Instead of checking millions of records one by one, it builds an index that lets the system locate relevant data without scanning the entire dataset for every request. This makes it useful for full-text search, filtering, logs, product catalogs, reports, and other applications where users expect results as they type or filter. But adding Elasticsearch does not automatically make a search system fast. Query design, index mappings, response size, data ingestion, and frontend rendering can all affect how quickly a search feels to the person using it.
Here is a full-stack guide to searching millions of records without freezing the frontend.
It's a story most of us have lived through in some form.
Your database starts groaning under the weight of a few million records. Every LIKE %query% clause is a small act of violence against your CPU. So the team makes the obvious call: bring in Elasticsearch.
For a while, it's magic. Queries come back in 15 milliseconds. Full-text search just works. Everyone's happy.
Then, six months later, the index has grown into something with millions of dense, deeply nested documents, and the complaints start rolling in: "Every time I search the reports page, the screen freezes for four seconds, my fan spins up, and sometimes the tab just dies."
Which is confusing, because Elasticsearch is built to query petabytes in milliseconds. So why does it feel like the frontend is choking?
In practice, it almost never has anything to do with Elasticsearch's raw power. The real bottleneck is nearly always some combination of how the queries are written, how the data was indexed in the first place, how much JSON gets shipped over the wire, and what the browser is asked to do with it once it arrives.
This is a walk through the places that tend to go wrong — on the backend, at index time, and in the browser — and what to do instead.
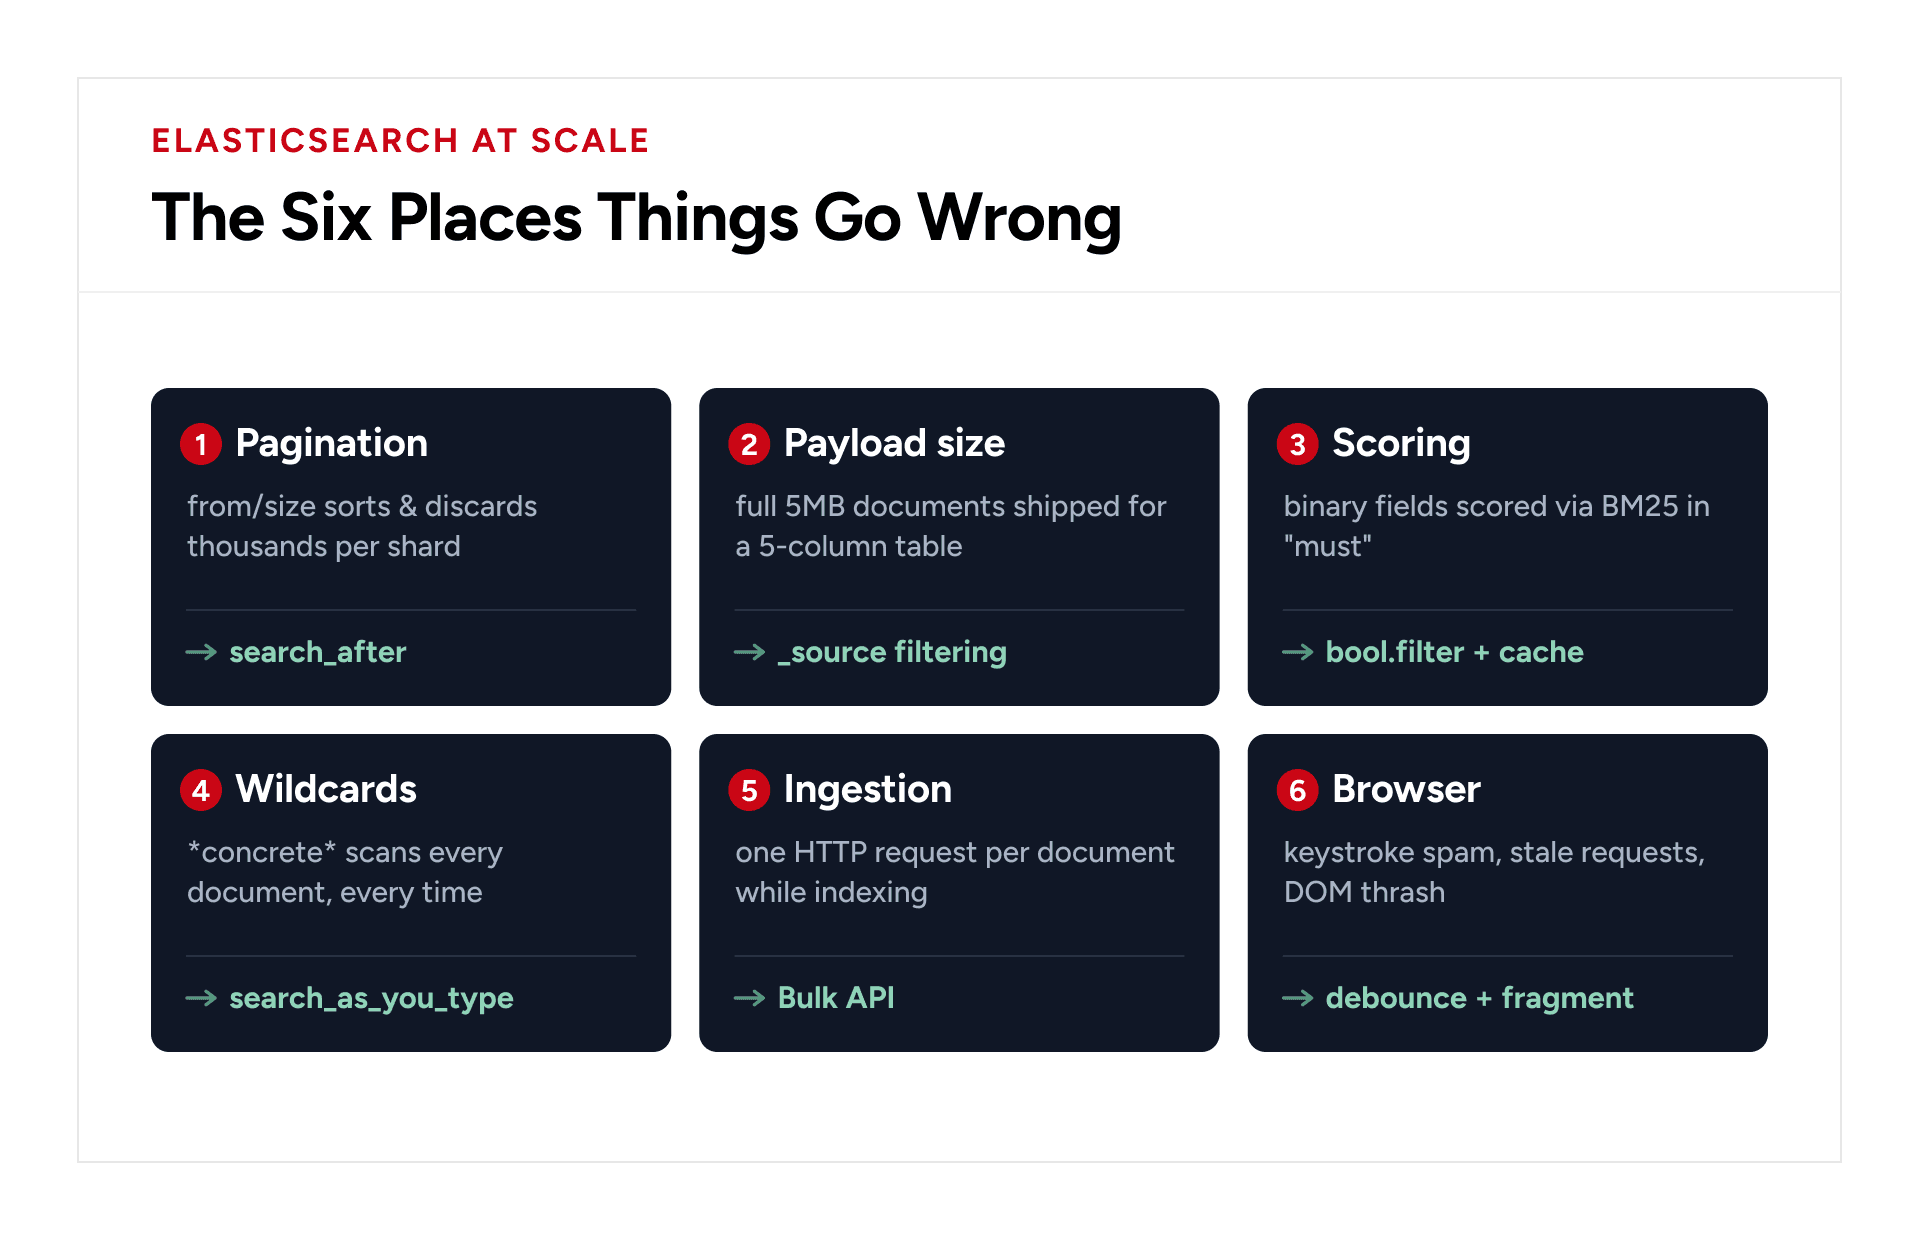
1. The deep pagination trap
Say you're building a paginated table. The natural instinct is page-number pagination:
// Page 100, 50 items per page
{
"from": 5000,
"size": 50,
"query": { "match_all": {} }
}
Looks harmless enough. Here's what it actually does to your cluster.
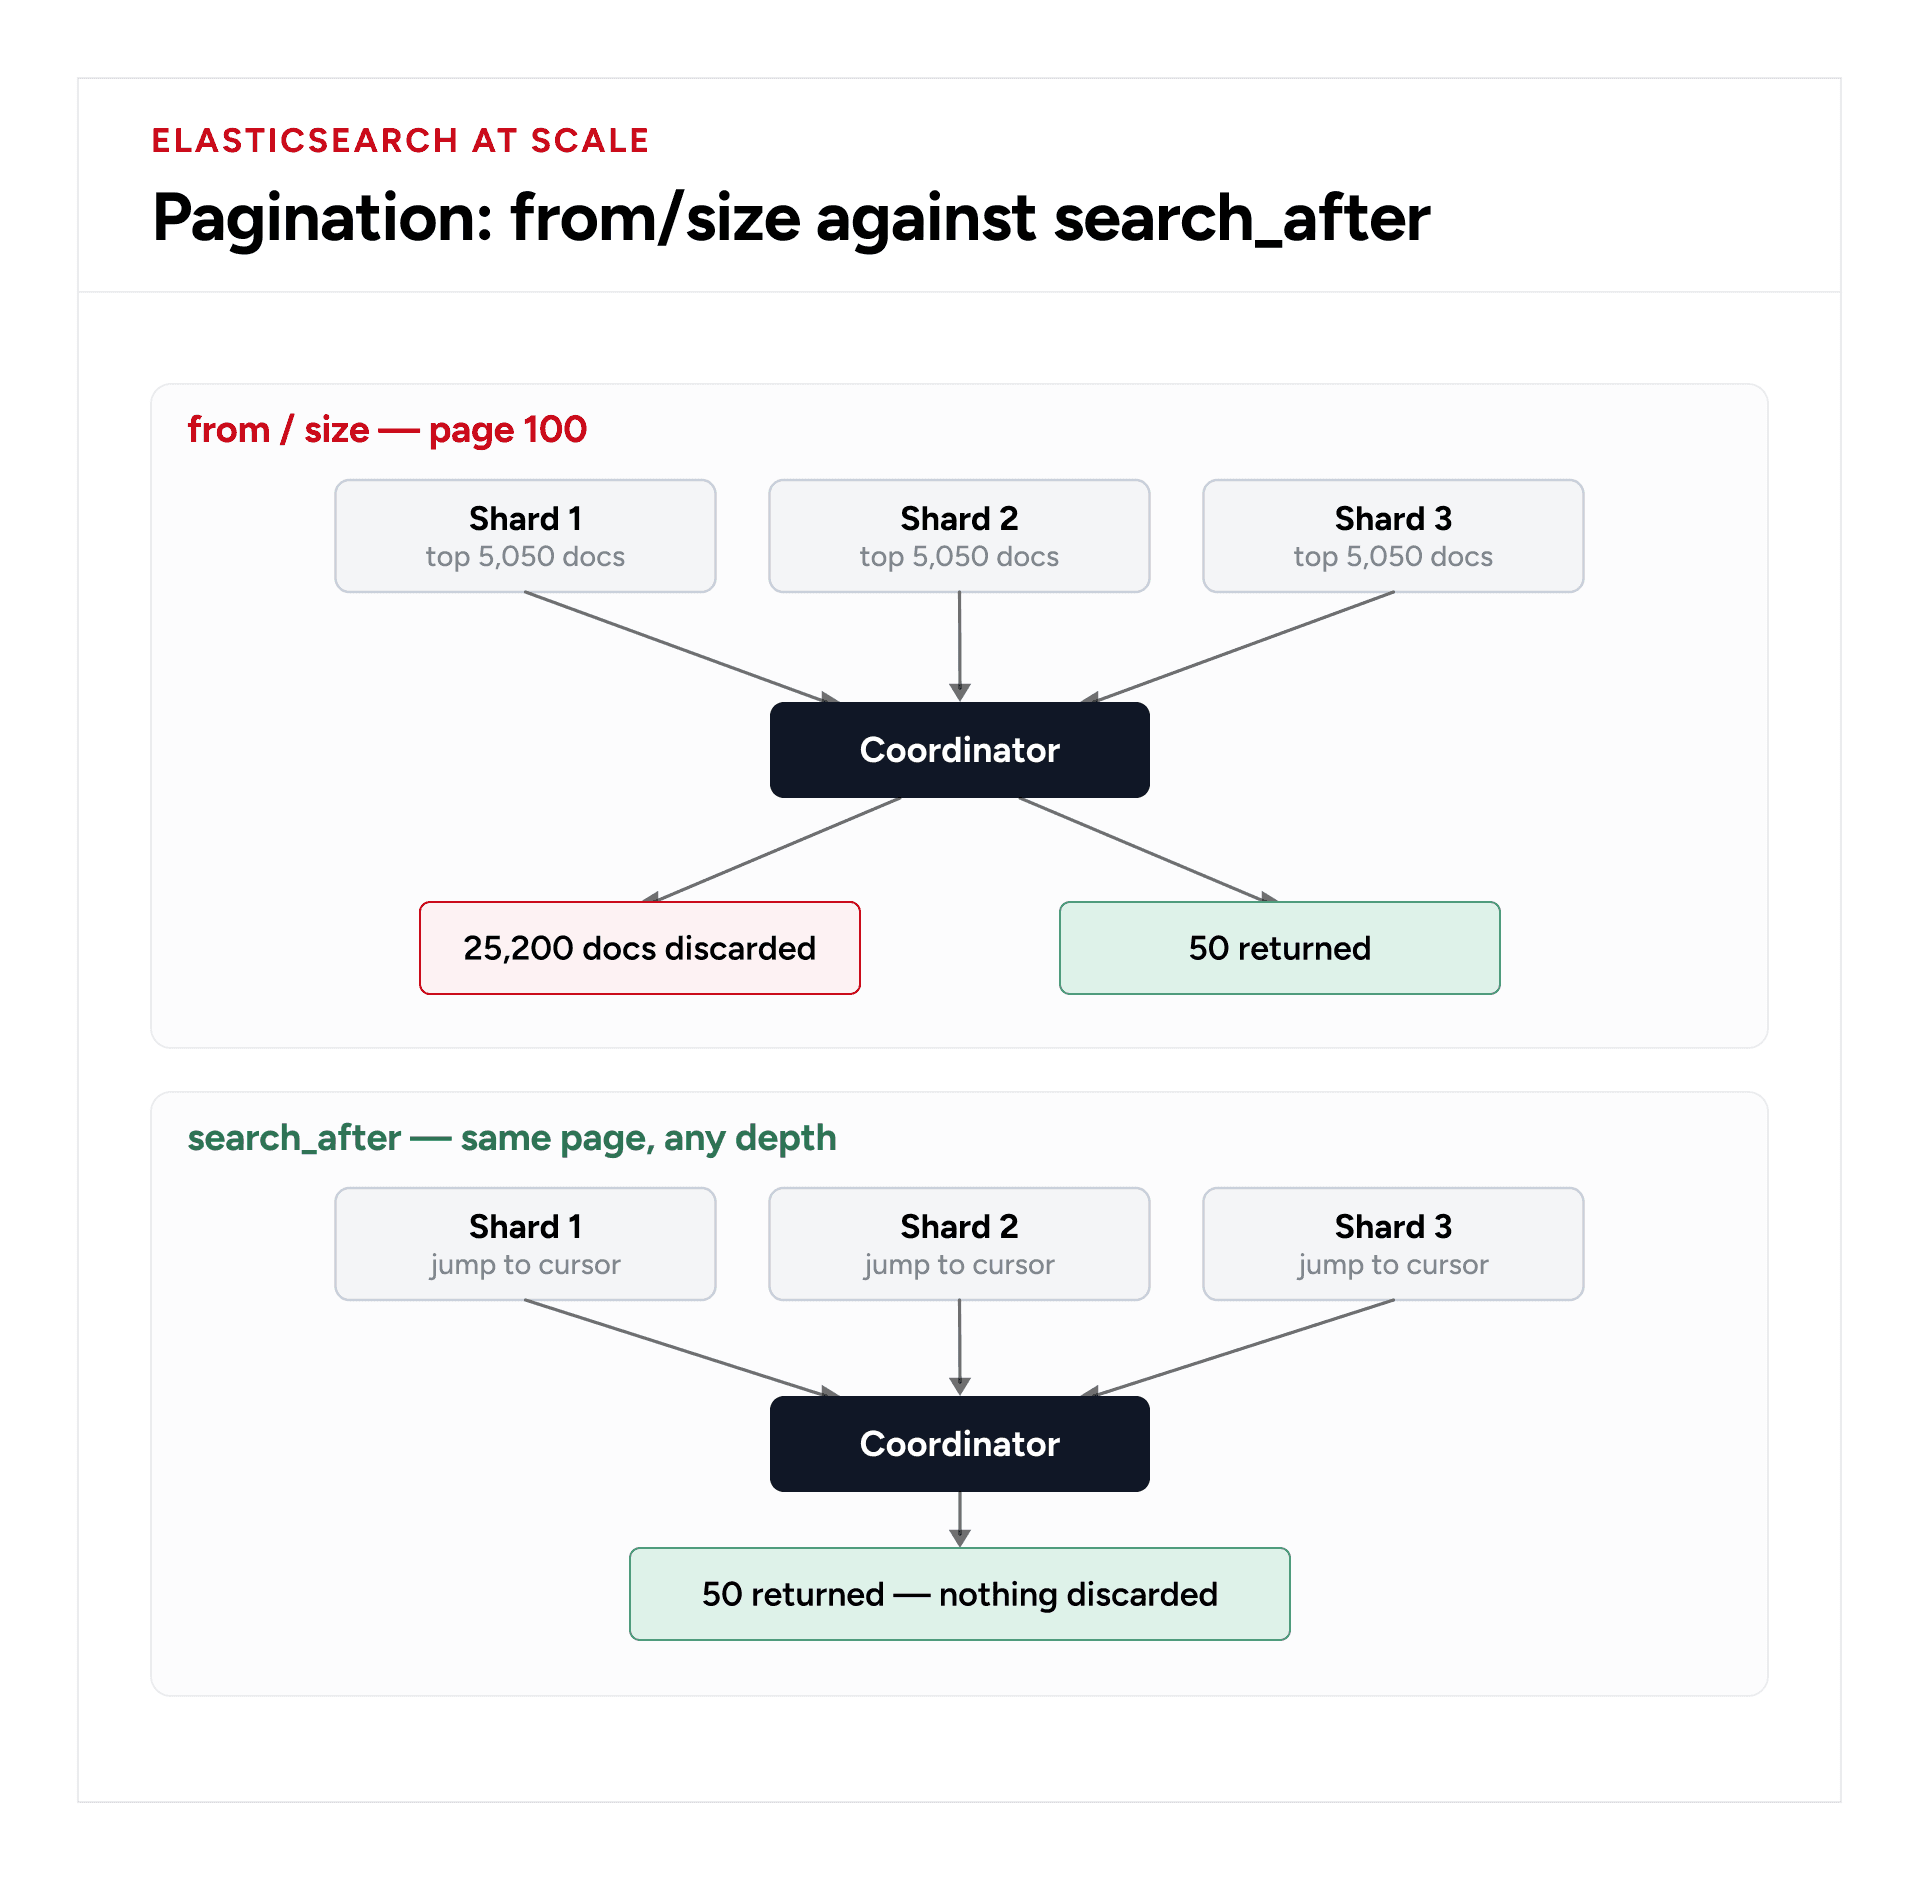
If your index is spread across 5 shards and you ask for items 5,000–5,050, each shard has to hand its top 5,050 documents to the coordinator node — not just the 50 you want. That's 5 × 5,050 = 25,250 documents pulled into memory, sorted, and then almost entirely thrown away, just so the coordinator can hand you the 50 that were left over.
By the time users are clicking into page 200, your cluster is burning most of its CPU sorting documents it's about to discard. Push it far enough and Elasticsearch will simply refuse — from + size beyond 10,000 hits the index.max_result_window limit by default. (Plenty of teams just raise that limit instead of fixing the underlying issue, which only postpones the memory problem.)
There isn't one correct fix here — it depends on how people actually navigate your UI.
If you have clickable page numbers ("1, 2, 3 ... 25") and people genuinely jump around, from / size is fine. Just cap how deep it goes. Restricting navigation to roughly the first 200 pages ( from + size < 10,000 ) is safe for almost any real-world dataset.
If you have infinite scroll or a "Load more" button, reach for search_after instead:
{
"size": 50,
"query": { "match_all": {} },
"sort": [
{ "created_at": "desc" },
{ "_id": "asc" }
],
"search_after": ["2026-09-20T14:30:00Z", "doc-10482"]
}
Instead of asking for "page 50," you're saying "give me whatever comes right after this document." Each shard jumps straight to that point in its sorted index — no sorting through thousands of discarded documents, no memory spike. Item 50 and item 5,000,000 cost roughly the same.
The catch: search_after only moves forward. There's no jumping to an arbitrary page — it's a cursor, not a page number, and your UI needs to reflect that.
If you're exporting thousands of rows to CSV or PDF, use a Point-in-Time (PIT) reader combined with search_after . PIT freezes a consistent snapshot of the index, so the export doesn't shift under you if documents get added mid-run.
2. Stop sending the whole warehouse back
Documents in a real system tend to accumulate weight. Customer profiles, nested inspection logs, historical audit trails — it's not unusual for a single document to sit at 50–200 KB.
Now return 50 of those without restricting fields, and you're shipping something like 5 MB of JSON for a single page load. And what actually happens with that 5 MB?
It takes over a second just to download.
The browser has to parse a multi-megabyte string, which locks up the main thread while it does.
The UI stutters, animations skip, and the user assumes something's broken.
Meanwhile, your table is probably showing five columns: ID, code, date, inspector, status.
The fix is boring but effective — tell Elasticsearch exactly which fields you actually need:
{
"size": 50,
"_source": [
"id",
"report_code",
"start_date",
"inspector_name",
"status"
],
"query": { ... }
}
Strip out the nested arrays and raw submission blobs you're not displaying, and that 5 MB response often drops to something like 40 KB. At that size, parsing takes a couple of milliseconds and the UI never even notices.
3. Don't score things that can't be scored
Elasticsearch draws a real distinction between two kinds of query clauses:
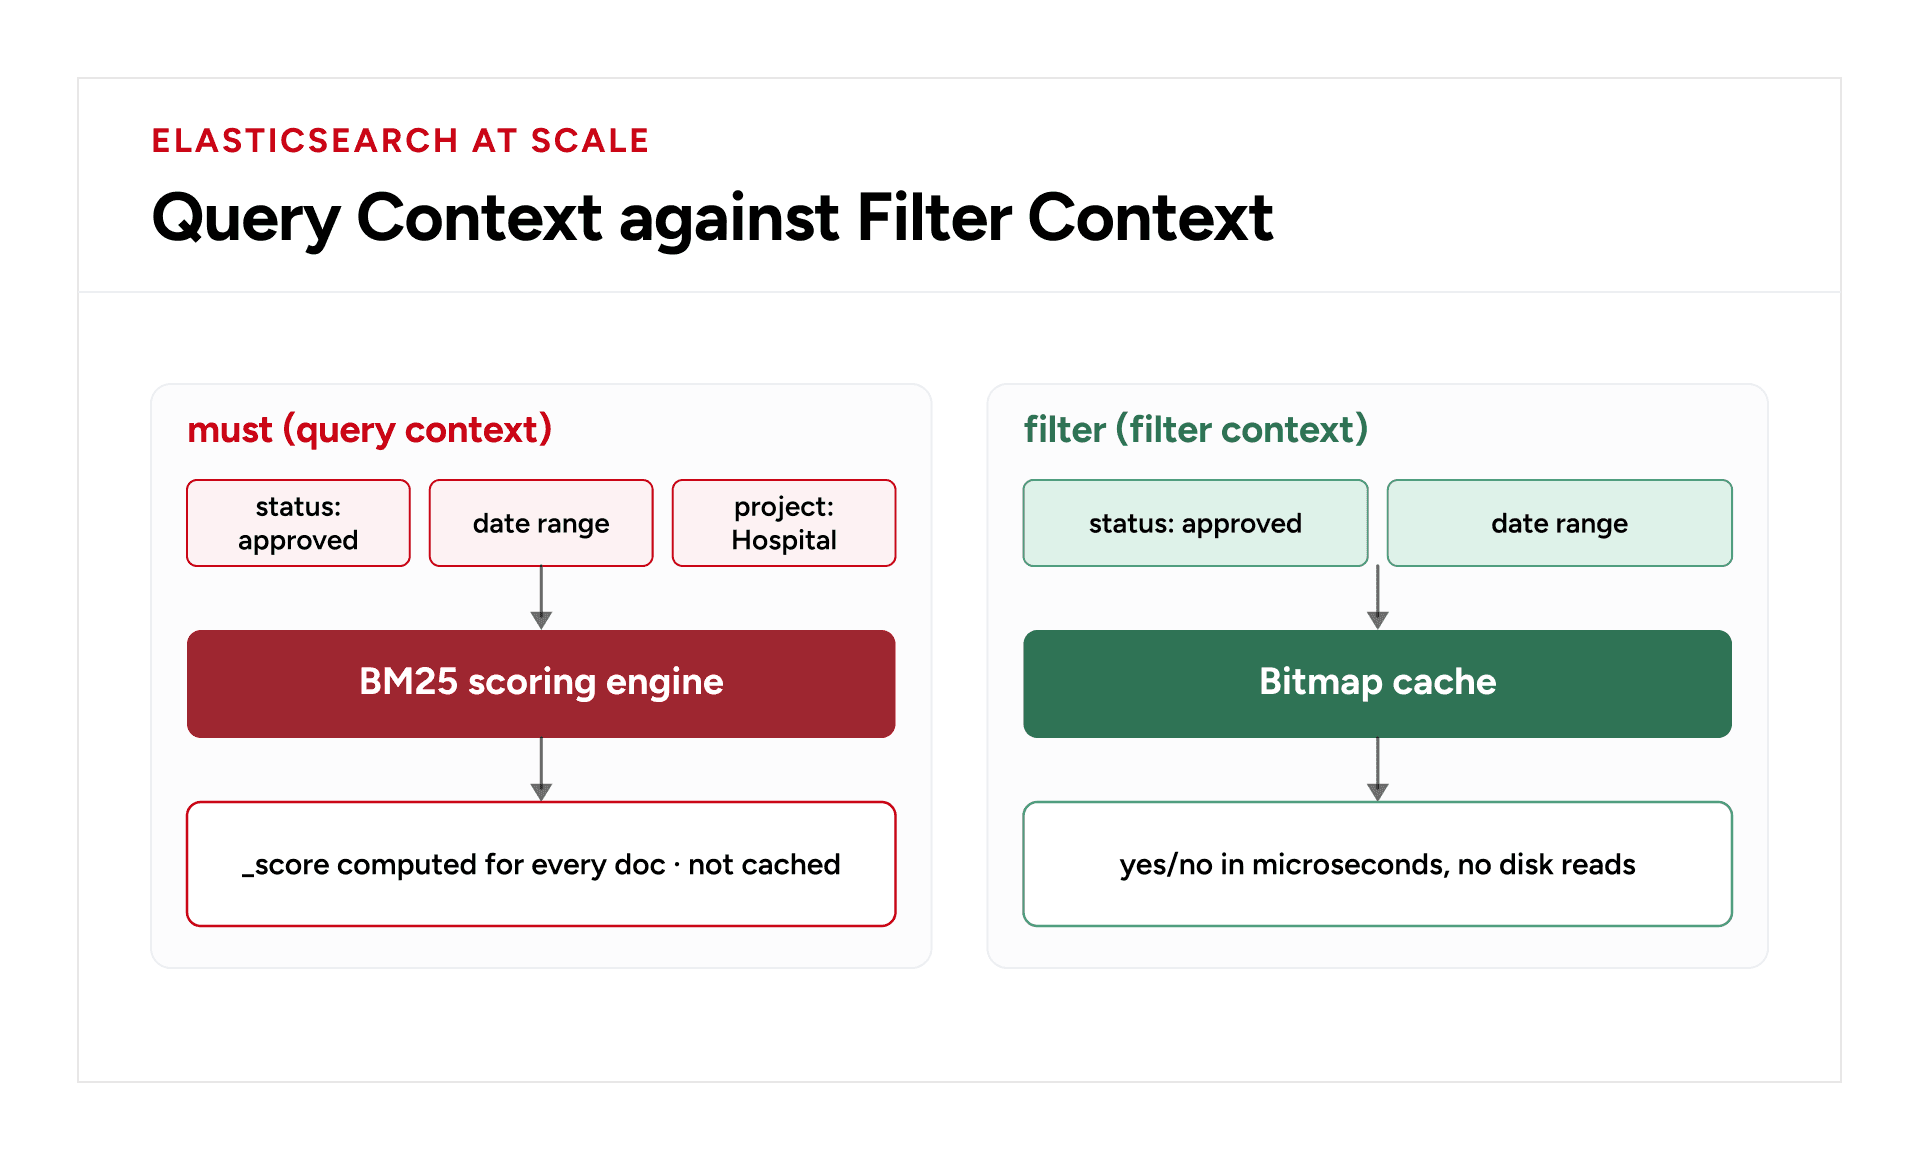
Query context ( must , should ) — "how well does this match?" It runs BM25 scoring and produces a _score . Filter context ( filter , must_not ) — "does this match, yes or no?" No scoring. Purely binary.
A mistake that shows up constantly:
// Slow — forces scoring on things that don't have a "degree" of matching
{
"query": {
"bool": {
"must": [
{ "match": { "status": "approved" } },
{ "range": { "start_date": { "gte": "2026-01-01" } } },
{ "match": { "project_name": "Hospital" } }
]
}
}
}
Is one "approved" report more approved than another? Obviously not — it's binary. But by putting exact-match conditions like status and date inside must , you're asking Elasticsearch to spend CPU scoring things that were never going to have a meaningful score. Worse, clauses inside must skip the filter cache entirely.
Move anything binary into filter :
// Fast — only the full-text part gets scored
{
"query": {
"bool": {
"must": [
{ "match": { "project_name": "Hospital" } }
],
"filter": [
{ "term": { "status.keyword": "approved" } },
{ "range": { "start_date": { "gte": "2026-01-01" } } }
]
}
}
}
The payoff isn't just skipping scoring — Elasticsearch also caches filter clauses as bitmap structures in memory. The next time anyone filters by status: approved , that part of the query resolves in microseconds without touching the disk.
A decent rule of thumb: if a field is either "yes" or "no," with no concept of how well it matches, it belongs in the filter.
4. The leading wildcard problem
When people want search-as-you-type or partial matching, the tempting shortcut looks like this:
{
"query": {
"query_string": {
"query": "*concrete*",
"fields": ["notes", "sample_description"]
}
}
}
A leading wildcard — *concrete , not concrete* — essentially disables the inverted index. Think of the index like the back of a textbook: search for "concrete" and you flip straight to the right page. Search for *concrete* and the book is useless to you — you're back to reading every word on every page, because there's no way to know in advance what might precede "concrete."
Run that across a few million documents and you get exactly the CPU spikes and multi-second delays you'd expect.
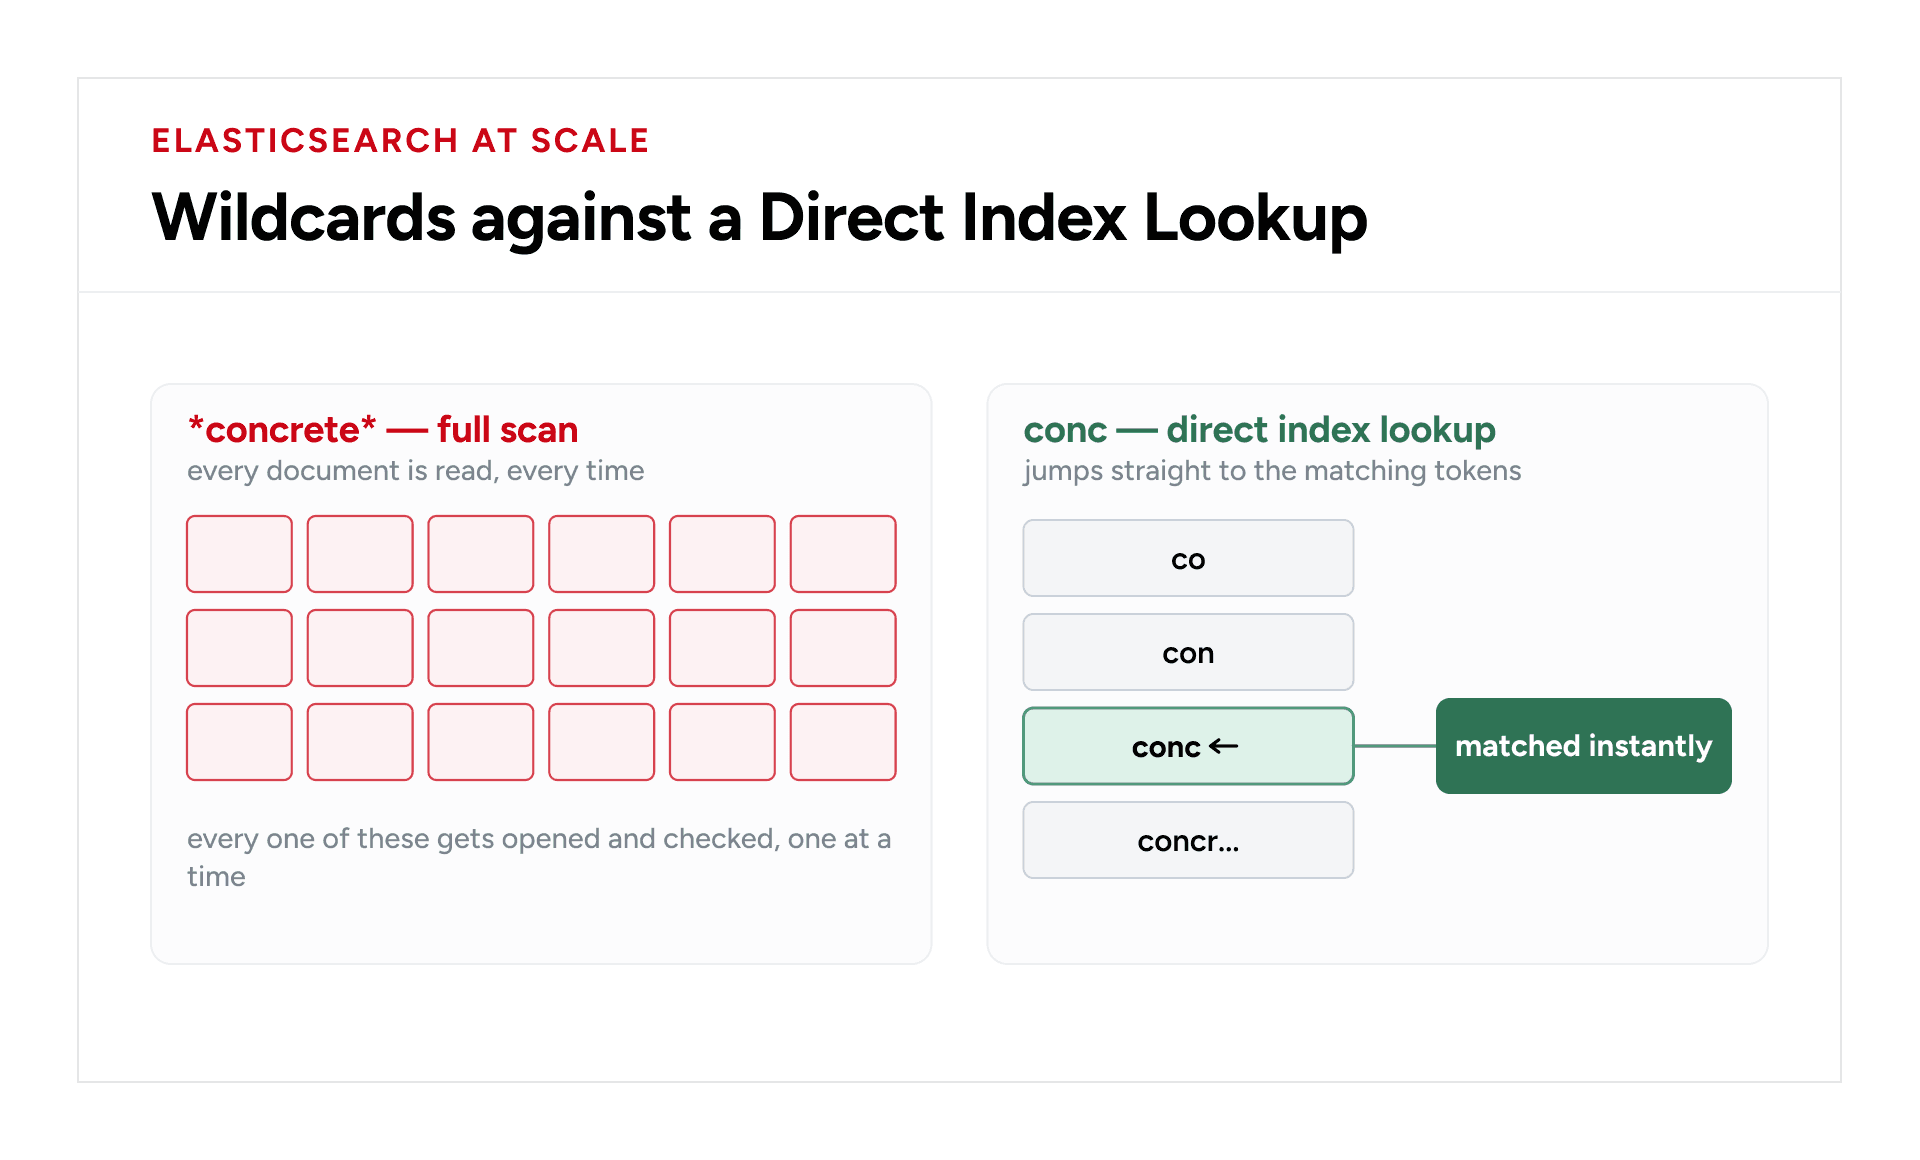
The real fix happens at index time, not query time. The simplest route is Elasticsearch's built-in search_as_you_type field type. First, declare the field this way when you create (or update) your mapping:
PUT /reports
{
"mappings": {
"properties": {
"sample_description": {
"type": "search_as_you_type"
}
}
}
}
Elasticsearch quietly builds sub-fields behind the scenes ( sample_description._2gram , ._3gram , and so on) that store prefix tokens. The word "concrete" ends up indexed as something like ["co", "con", "conc", "concr", "concre", "concret", "concrete"] . Then query with bool_prefix instead of a wildcard:
{
"query": {
"multi_match": {
"query": "conc",
"type": "bool_prefix",
"fields": [
"sample_description",
"sample_description._2gram",
"sample_description._3gram"
]
}
}
}
Now typing "conc" resolves as a direct term lookup against pre-built tokens instead of a full scan of the cluster.
The tradeoff: n-gram indexing inflates the size of the affected fields, typically by something like 2–3x, since you're now storing every prefix variant on disk. For most applications that's a non-issue next to the speed gain — but if storage is tight, you can bound the range ( min_gram: 3, max_gram: 10 ) to keep it in check.
5. The part everyone forgets: how you write data in
Most of the attention in Elasticsearch tuning goes to queries, but a surprising share of real-world slowness starts at ingestion. This pattern shows up in almost every codebase the first time a team wires up Elasticsearch:
# One HTTP request per document — the classic mistake
reports = get_all_pending_reports()
for report in reports:
document = build_document(report)
elasticsearch.index(index="reports", body=document)
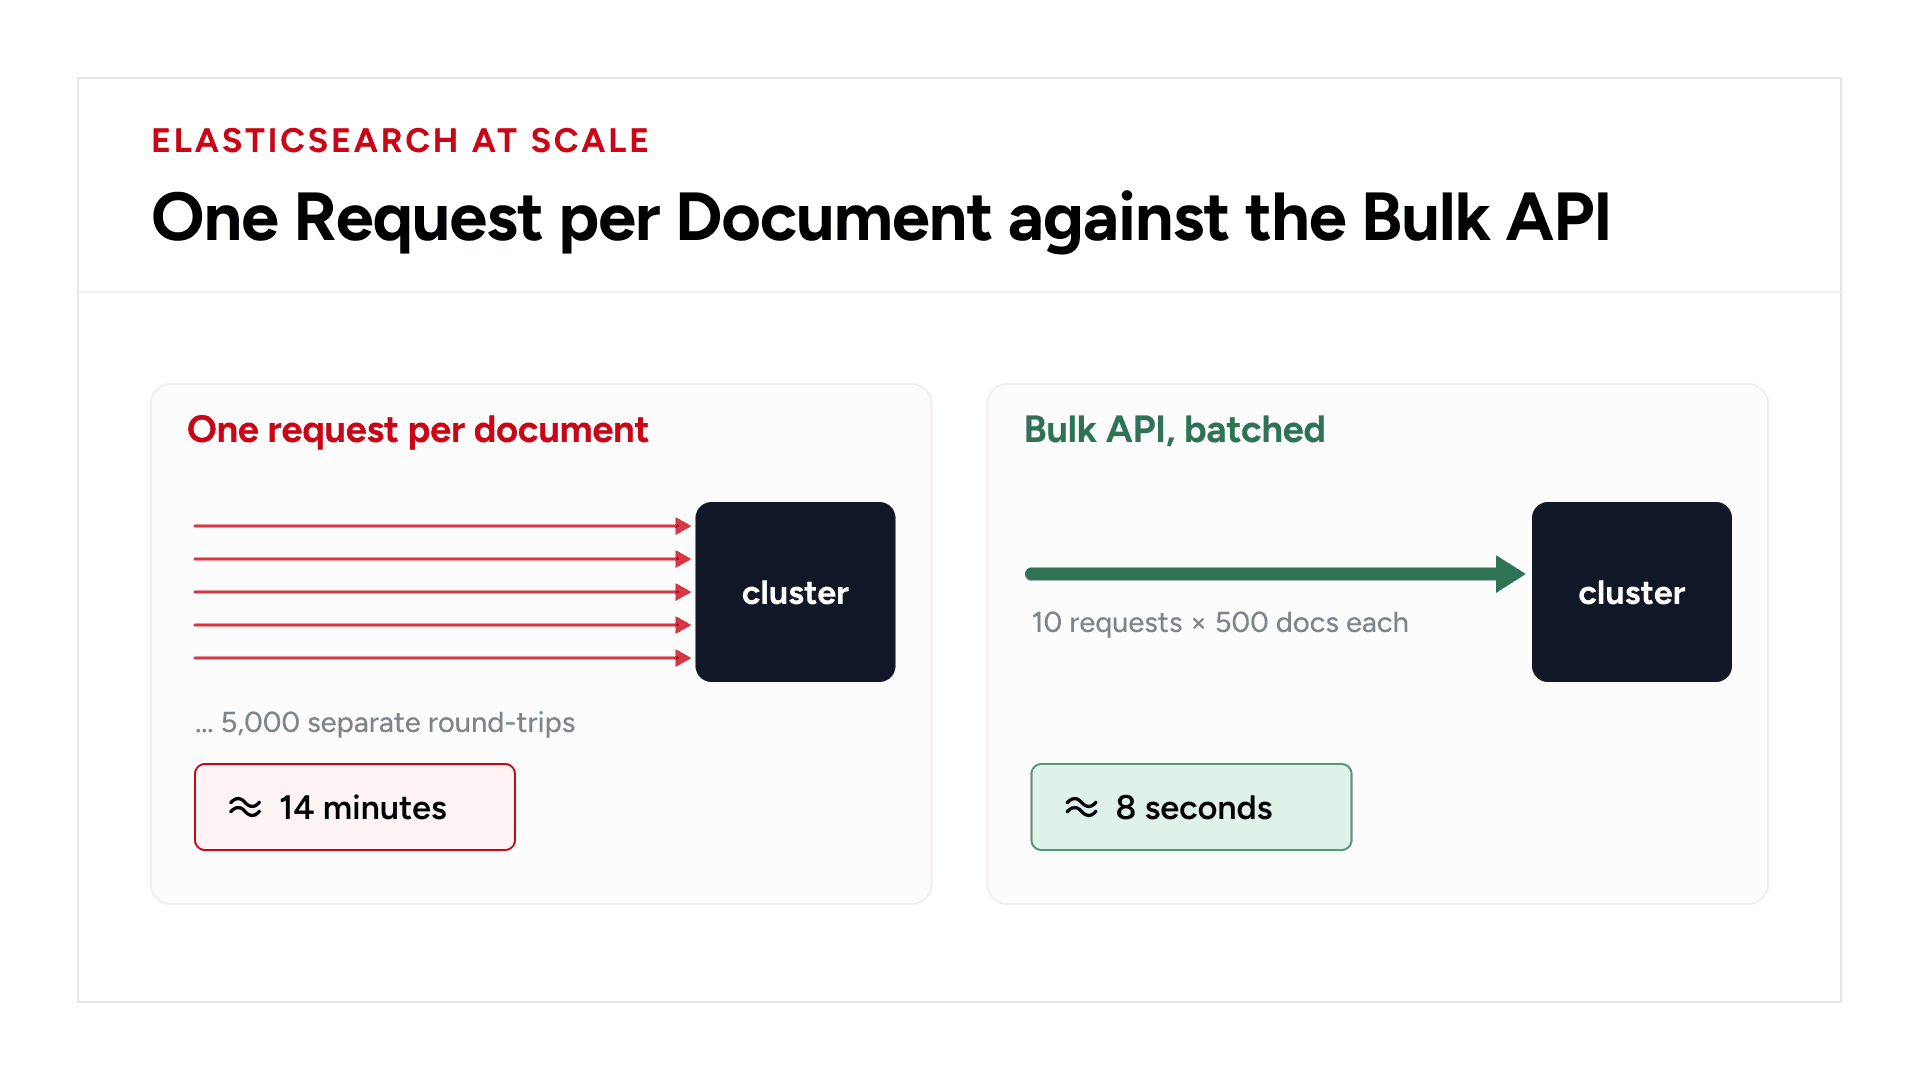
5,000 reports means 5,000 separate HTTP round-trips, each one negotiating its own connection and potentially triggering a refresh. What should take a few seconds can easily stretch into 10–15 minutes.
The Bulk API exists precisely for this — batch hundreds or thousands of operations into a single request:
reports = get_all_pending_reports()
batch = []
for report in reports:
document = build_document(report)
batch.append({ "index": { "_index": "reports" } })
batch.append(document)
if len(batch) >= 1000: # 500 docs per flush (action + doc = 2 lines each)
elasticsearch.bulk(body=batch)
batch = []
if batch:
elasticsearch.bulk(body=batch) # flush whatever's left
Batching 500 documents per call turns 5,000 individual requests into 10. The difference is dramatic in practice — bulk indexing typically runs somewhere around 10–50x faster than indexing one document at a time.
One request per document
Two smaller things worth doing alongside this:
Loosen the refresh interval during heavy writes. By default, Elasticsearch refreshes every index every second so new documents become searchable almost immediately. During a large backfill, that constant refreshing just burns CPU for no benefit. Turn it down while you're bulk-loading:
PUT /reports/_settings
{ "index": { "refresh_interval": "30s" } }
and set it back once you're done:
PUT /reports/_settings
{ "index": { "refresh_interval": "1s" } }
Give documents a stable ID. If a pipeline ever retries after a partial failure, it can easily index the same record twice. Use a consistent ID — your database primary key works well — so Elasticsearch overwrites the old copy instead of quietly duplicating it:
# Passing "id" turns this into an upsert — no duplicate rows
elasticsearch.index(index="reports", id=report.id, body=document)
6. Don't let the browser undo all of that work
Even a 20-millisecond Elasticsearch response can still end in a frozen tab if the frontend isn't careful. Three things worth having in place:
Debounce input. Typing "Bridge Inspection" is 17 keystrokes in about a second and a half. Fire a request per keystroke and you've just sent 17 overlapping searches. A 300ms debounce — wait until the user actually pauses — fixes this outright.
Cancel stale requests. If someone types "B" and then quickly finishes "Bridge," the request for "B" is now irrelevant. If it happens to resolve after the "Bridge" request, your table briefly shows the wrong results. AbortController handles this cleanly:
let currentController = null;
function fetchSearchResults(query) {
if (currentController) {
currentController.abort(); // kill the previous request
}
currentController = new AbortController();
fetch(`/api/search?q=${encodeURIComponent(query)}`, {
signal: currentController.signal
})
.then(res => res.json())
.then(data => renderTable(data.items))
.catch(err => {
if (err.name !== 'AbortError') console.error('Fetch error:', err);
});
}
Batch your DOM writes. Inserting 200 rows one at a time into a live table forces the browser to recalculate layout after each insertion. Build everything off-screen first, then insert it in one shot:
function renderTable(items) {
const tableBody = document.getElementById('tableBody');
const fragment = document.createDocumentFragment();
items.forEach(item => {
const row = document.createElement('tr');
row.innerHTML = `
<td>${item.id}</td>
<td>${item.report_code}</td>
<td>${item.inspector_name}</td>
<td>${item.status}</td>
`;
fragment.appendChild(row);
});
tableBody.innerHTML = '';
tableBody.appendChild(fragment); // single repaint
}
Worth flagging: building rows this way with innerHTML is only safe if none of those fields can contain arbitrary user text. If inspector_name or similar could ever hold something a user typed, that's an XSS opening — building rows with textContent instead closes it off.
Past 500 rows or so, consider a virtualized table that only renders the 15–20 rows actually visible in the viewport, rather than materializing the entire result set as DOM nodes.
What it looks like put together
None of these changes are individually dramatic. Together, they compound. For an application with roughly 800,000 indexed documents, applying all six optimizations could produce improvements in this range:
Metric | Before | After |
Search response time | ~3.2s | ~45ms |
JSON payload size | ~4.8 MB | ~38 KB |
Frontend render time | ~1,400ms | ~12ms |
Bulk reindex (5,000 docs) | ~14 min | ~8 sec |
Cluster CPU during search | ~78% sustained | Single-digit spikes |
(These are illustrative figures based on the kind of improvement this set of changes typically produces — worth replacing with your own measured numbers once you've made the changes on your own system.)
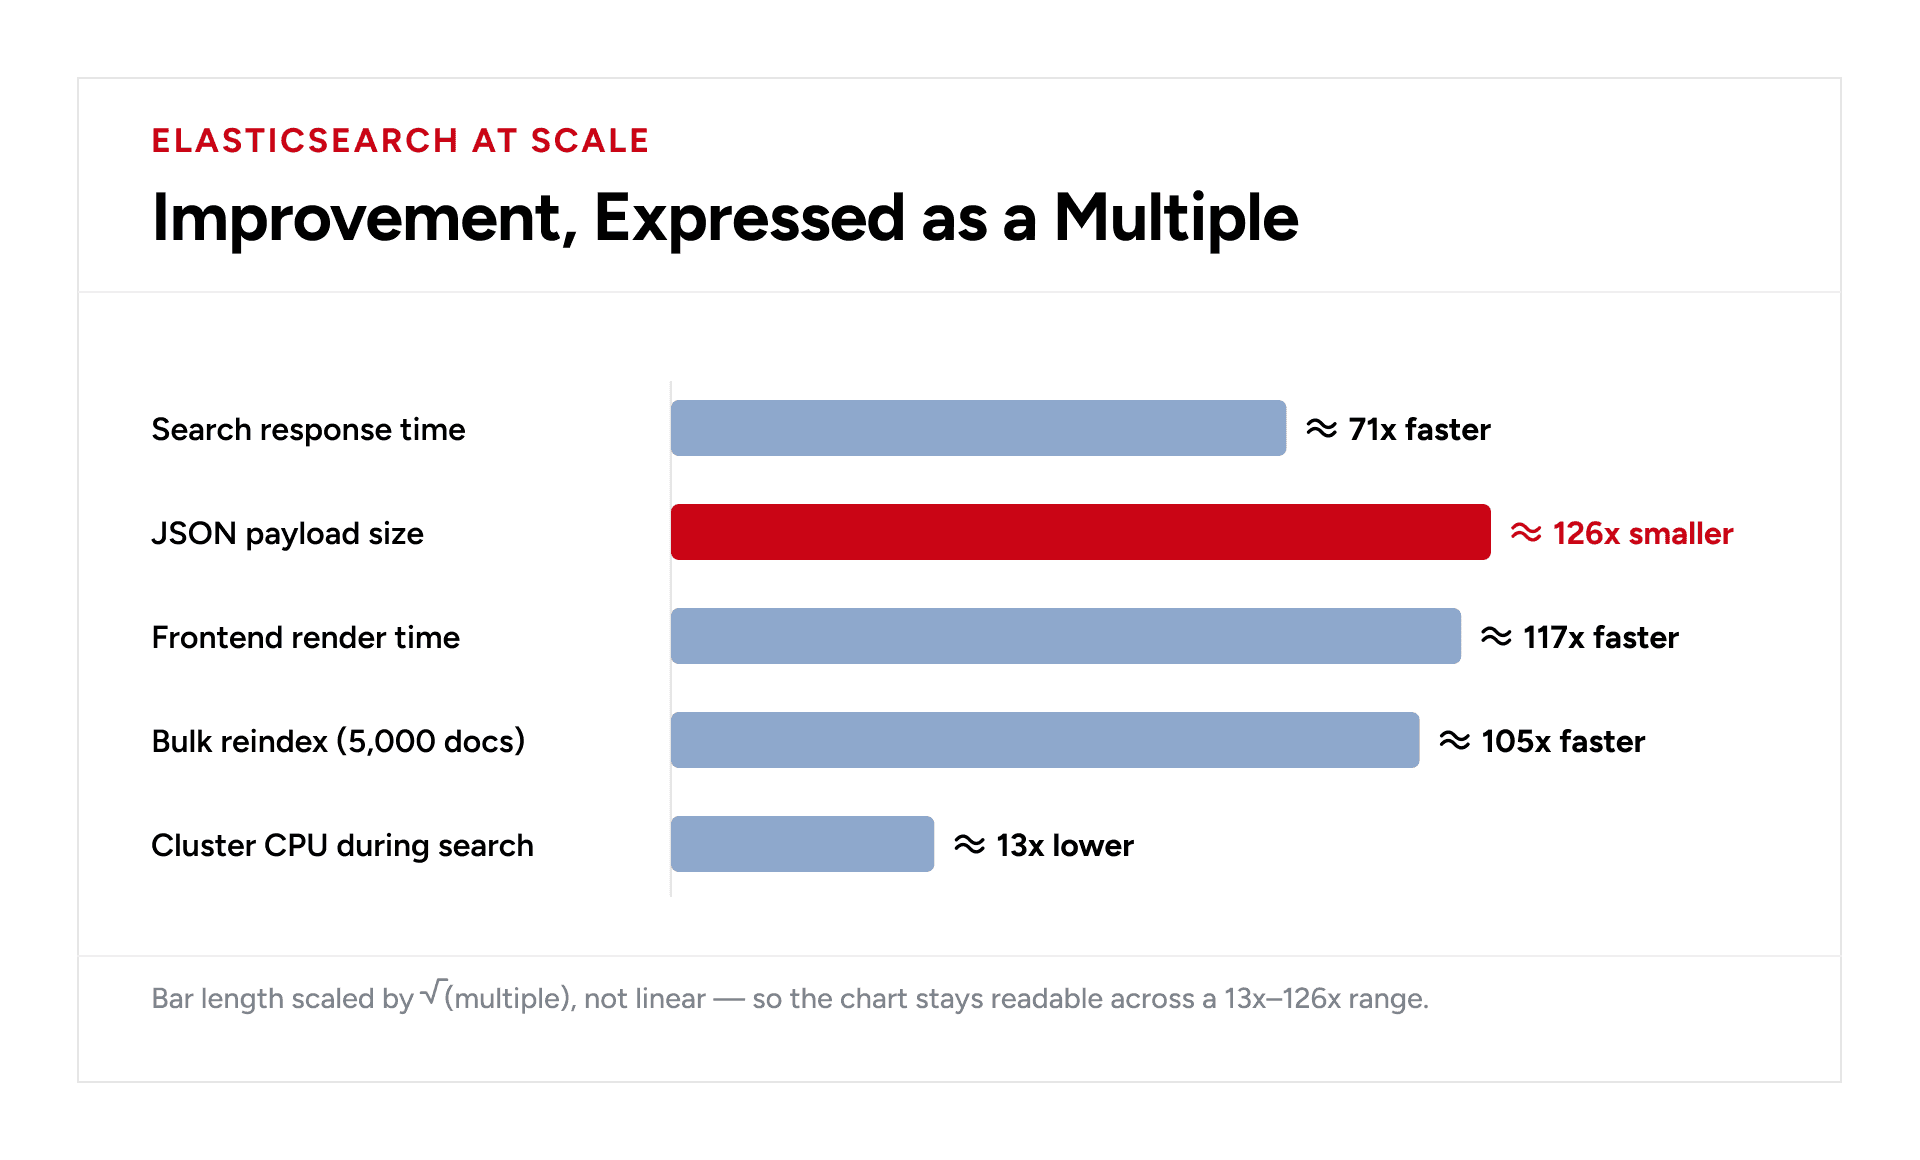
A 45ms response with a 38KB payload that renders in 12ms doesn't just feel fast — it feels instant, even on a phone over 4G.
Cheatsheet
Use this cheatsheet to quickly match common Elasticsearch performance issues with their likely cause and fix.
Symptom | What's Actually Happening | Fix |
Deep pagination ( | Coordinator sorts and discards thousands of docs per shard |
|
Giant payloads (5MB JSON) | Full documents returned when only a few fields are shown |
|
Slow filtering | Exact-match fields scored unnecessarily | Move to |
Leading wildcards ( | Inverted index can't be used, full scan instead |
|
Slow bulk imports | One HTTP request per document | Bulk API, batched |
UI freezes while typing | No debounce, requests racing | 300ms debounce + |
Table rendering stutters | DOM reflow on every row insert |
|
The Underlying Idea
Every fix above is really the same move, applied in a different place: figure out where work is happening, and ask whether it's happening at the right time.
Push computation to index time (n-grams, explicit mappings) instead of query time (wildcards). Push filtering into the cache layer ( bool.filter ) instead of the scoring layer ( bool.must ). Push payload decisions onto the backend ( _source filtering) instead of asking the browser to parse everything and use a fraction of it. Push DOM construction into memory ( DocumentFragment ) instead of doing it row-by-row on the live page.
If you want a concrete place to start: open your slowest search endpoint right now and add _source filtering so it only returns the fields your UI actually shows. Check the response size before and after. That alone is usually a five-minute change that cuts payload by 90% and makes the page feel noticeably different.
Everything else in this piece can follow from there, one endpoint at a time.
Turn Elasticsearch Performance Into Product Performance
A fast Elasticsearch query means little if the API sends megabytes of JSON or the browser spends a second rendering it. Search performance has to be addressed across indexing, APIs, infrastructure, and the frontend. GeekyAnts helps teams optimize these systems through enterprise backend development and modernization, covering backend architecture, data pipelines, performance tuning, and systems built to handle growing data volumes. The goal is simple: keep search responsive as the dataset grows, without making every new record or user request more expensive than it needs to be.