

Picture this: a hungry user, eyes fixed on their phone, trying to place an order on your food delivery app. But every tap is met with sluggish responses. Frustration mounts, and before you know it, they’ve switched to a competitor. It’s a nightmare scenario for any app developer. Performance isn’t just a technical metric—it’s the heartbeat of user experience. Thankfully, with tools like Playwright and Lighthouse, you can ensure your app keeps up with even the hungriest users.
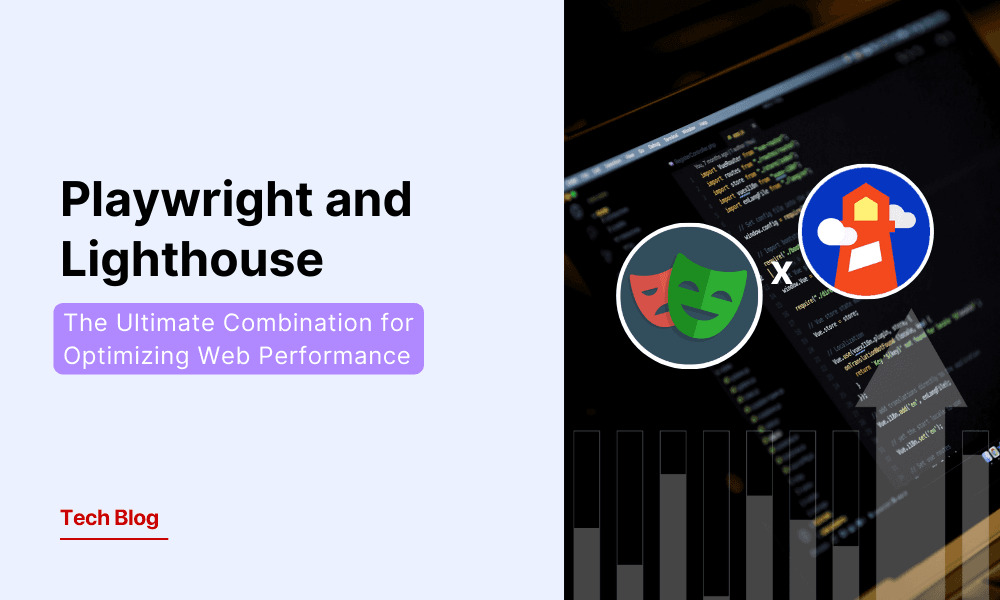
Enter Lighthouse and Playwright—two powerful tools that, when combined, form a perfect duo for tackling front-end performance issues. This blog will dive into why these tools are better together, how to configure them, and how they can help you deliver blazing-fast web applications.
Why Performance Testing Matters
In today’s world, users expect websites to load in the blink of an eye. Studies show that even a one-second delay can reduce user satisfaction and conversion rates significantly. Performance isn’t just about speed; it’s about ensuring seamless interactions that delight users.
Whether it’s a collaborative dashboard, a data-driven app, or even a simple landing page, performance is the invisible backbone of a great user experience.
Meet the Stars: Lighthouse and Playwright
Lighthouse: The Auditor
Lighthouse, developed by Google, is a robust open-source tool that evaluates web pages on:
- Performance (speed and responsiveness).
- Accessibility (ease of use for all users).
- Best practices (adherence to web standards).
- SEO (search engine visibility).
It provides actionable insights in a beautifully designed report.
Playwright: The Navigator
Playwright, a browser automation framework by Microsoft, lets you simulate real-world user interactions with ease. Whether logging in, navigating between pages, or testing specific workflows, Playwright handles complex scenarios effortlessly.
Why Combine Playwright and Lighthouse?
Lighthouse alone is excellent for static pages but struggles with dynamic, state-driven applications. For example:
- You can not test a page that requires login without extra configuration.
- Navigating complex workflows isn’t possible out of the box.
Playwright solves these limitations by acting as a guide, navigating your app’s intricate paths and preparing it for Lighthouse audits. Together, they enable robust performance testing under real-world conditions.
Step-by-Step Guide to Performance Testing with Playwright and Lighthouse
Let’s explore how you can configure Playwright and Lighthouse for front-end performance testing with detailed examples and code snippets.
Step 1: Install Dependencies
Start by installing the necessary packages:
bash
npm install playwright lighthouse @types/lighthouse
These libraries enable you to control browsers (Playwright) and audit performance metrics (Lighthouse).
Step 2: Write a Basic Test Script
Below is an example script to automate navigation and generate a Lighthouse report:
const { chromium } = require('playwright');
const lighthouse = require('lighthouse');
const { prepareAudit } = require('lighthouse/playwright');
const fs = require('fs');

(async () => {
    // Launch Playwright browser
    const browser = await chromium.launch({
        headless: true, // Run in headless mode
    });

    // Create a new page and navigate to the target URL
    const page = await browser.newPage();
    await page.goto('https://example.com');

    // Prepare for the Lighthouse audit
    const port = await prepareAudit(page);

    // Run Lighthouse audit
    const result = await lighthouse('https://example.com', {
        port,
        output: 'html', // Generate HTML report
        logLevel: 'info', // Show detailed logs during the audit
    });

    // Save the Lighthouse HTML report
    const reportHtml = result.report;
    fs.writeFileSync('lighthouse-report.html', reportHtml);

    console.log('Lighthouse report saved as lighthouse-report.html');

    // Close the browser
    await browser.close();
})();
Step 3: Customize Network and Device Conditions
Simulate real-world conditions like slow networks or mobile devices to make your tests more comprehensive.
await page.emulateNetworkConditions({
    downloadThroughput: 500 * 1024 / 8, // Simulate slow network
    uploadThroughput: 250 * 1024 / 8,
    latency: 300, // Simulate high latency
});
Lighthouse also allows you to specify mobile settings directly:
const result = await lighthouse('https://example.com', {
    port,
    output: 'html',
    logLevel: 'info',
    emulatedFormFactor: 'mobile',
    throttling: {
        rttMs: 150,
        throughputKbps: 1.6 * 1024,
    },
});
Step 4: Run and Analyze the Report
Execute your script using Node.js:
node lighthouse-playwright.jsThis will generate a lighthouse-report.html file, which you can open in a browser to view detailed insights like:
- Performance Scores: Evaluate how your page performs.
- Opportunities: See where improvements can be made, such as image optimization or reduced JavaScript execution time.
- Diagnostics: Deep-dive into render-blocking resources, unused CSS, and more.
Key Metrics to Focus On in Lighthouse Audits
When evaluating website performance using Lighthouse, these key metrics are particularly important to assess and improve the user experience:
1. First Contentful Paint (FCP)
- What It Measures: The time it takes for the first visible content to appear on the screen. This could be text, an image, or even a background.
- Why It Matters: A fast FCP gives users confidence that the page is loading and keeps them engaged.
Example:
Imagine a news website. FCP is the moment when the website’s logo or headline is first visible to the user. If this takes too long, users might abandon the page.
2. Largest Contentful Paint (LCP)
- What It Measures: The time it takes for the largest visible element (like a hero image, banner, or large text) to be fully rendered in the user’s viewport.
- Why It Matters: LCP directly impacts the perception of loading speed for the main content. A delay in LCP can make users feel the website is slow.
Example:
On an e-commerce site, the LCP might be a large featured product image. If it loads quickly, users can immediately start exploring the product.
3. Time to Interactive (TTI)
- What It Measures: The time it takes for the page to become fully interactive, meaning all buttons, forms, and links work without delay.
- Why It Matters: A fast TTI ensures users can engage with the website seamlessly without frustration.
Example:
On a social media platform, TTI is the moment when users can scroll the feed, click the “Like” button, or comment without any lag. If the page looks ready but actions don't work, it creates a poor experience.
4. Cumulative Layout Shift (CLS)
- What It Measures: The stability of visual elements on the page during loading. It tracks how often elements move unexpectedly.
- Why It Matters: High CLS can frustrate users, especially if they click on the wrong element due to a layout shift caused by a late-loading image or ad.
Example:
On a blog, CLS occurs when a large ad loads after the page content and pushes the text down. Users trying to read the article may lose their place or accidentally click the ad.
How These Metrics Work Together
Together, these metrics ensure that a website:
- Loads Quickly (FCP, LCP),
- Becomes Usable Swiftly (TTI),
- Remains Visually Stable (CLS).
Optimizing these aspects leads to a faster, smoother, and more enjoyable user experience that keeps visitors engaged and reduces bounce rates.
Lighthouse Alone vs. Lighthouse with Playwright
Feature | Lighthouse Alone | Lighthouse + Playwright |
Testing Logged-in Scenarios | Not Supported | Fully Supported |
Simulating Real-World Conditions | Limited | Comprehensive |
Handling Dynamic Applications | Static Pages Only | Dynamic States Supported |
Conclusion: Powering Performance Excellence
Combining Playwright and Lighthouse isn’t just about testing—it’s about delivering exceptional experiences. With Playwright handling complex workflows and Lighthouse offering deep insights, you can ensure your application remains fast, responsive, and user-friendly under any condition.
The web is fast-paced, and your users deserve nothing less. With this powerful duo in your toolkit, you can go beyond just meeting expectations—set the bar for what great performance looks like.